It’s been more than 2 years since the last time I wrote something here, and in that time a lot of things happened. Among those, one of the main highlights was me moving back to Igalia‘s WebKit team, but this time I moved as part of Igalia’s support infrastructure to help with other types of tasks such as general coordination, team facilitation and project management, among other things.
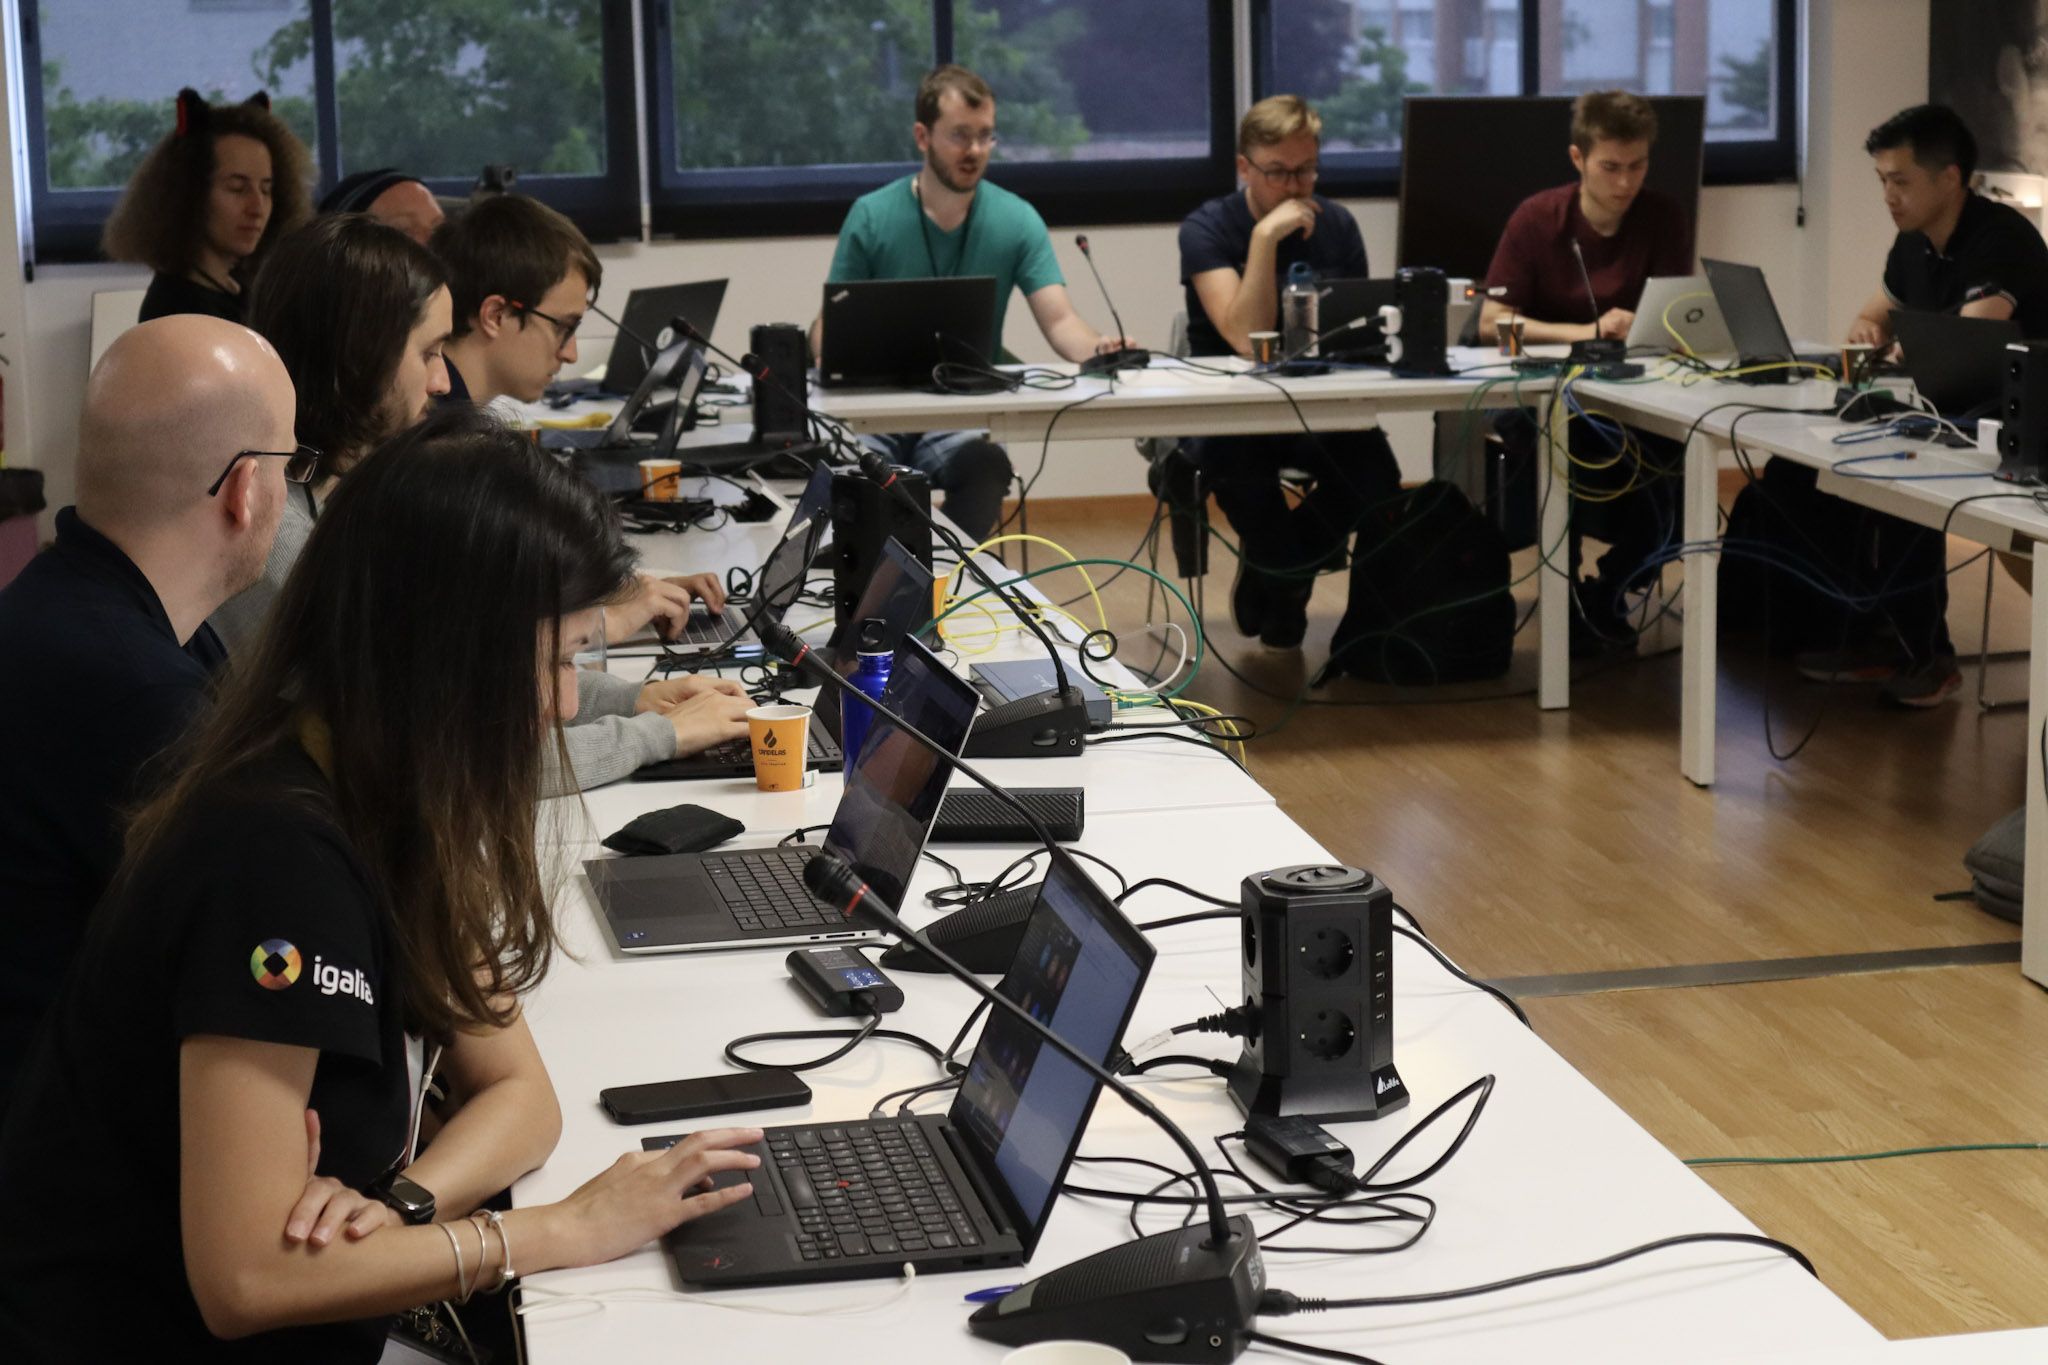
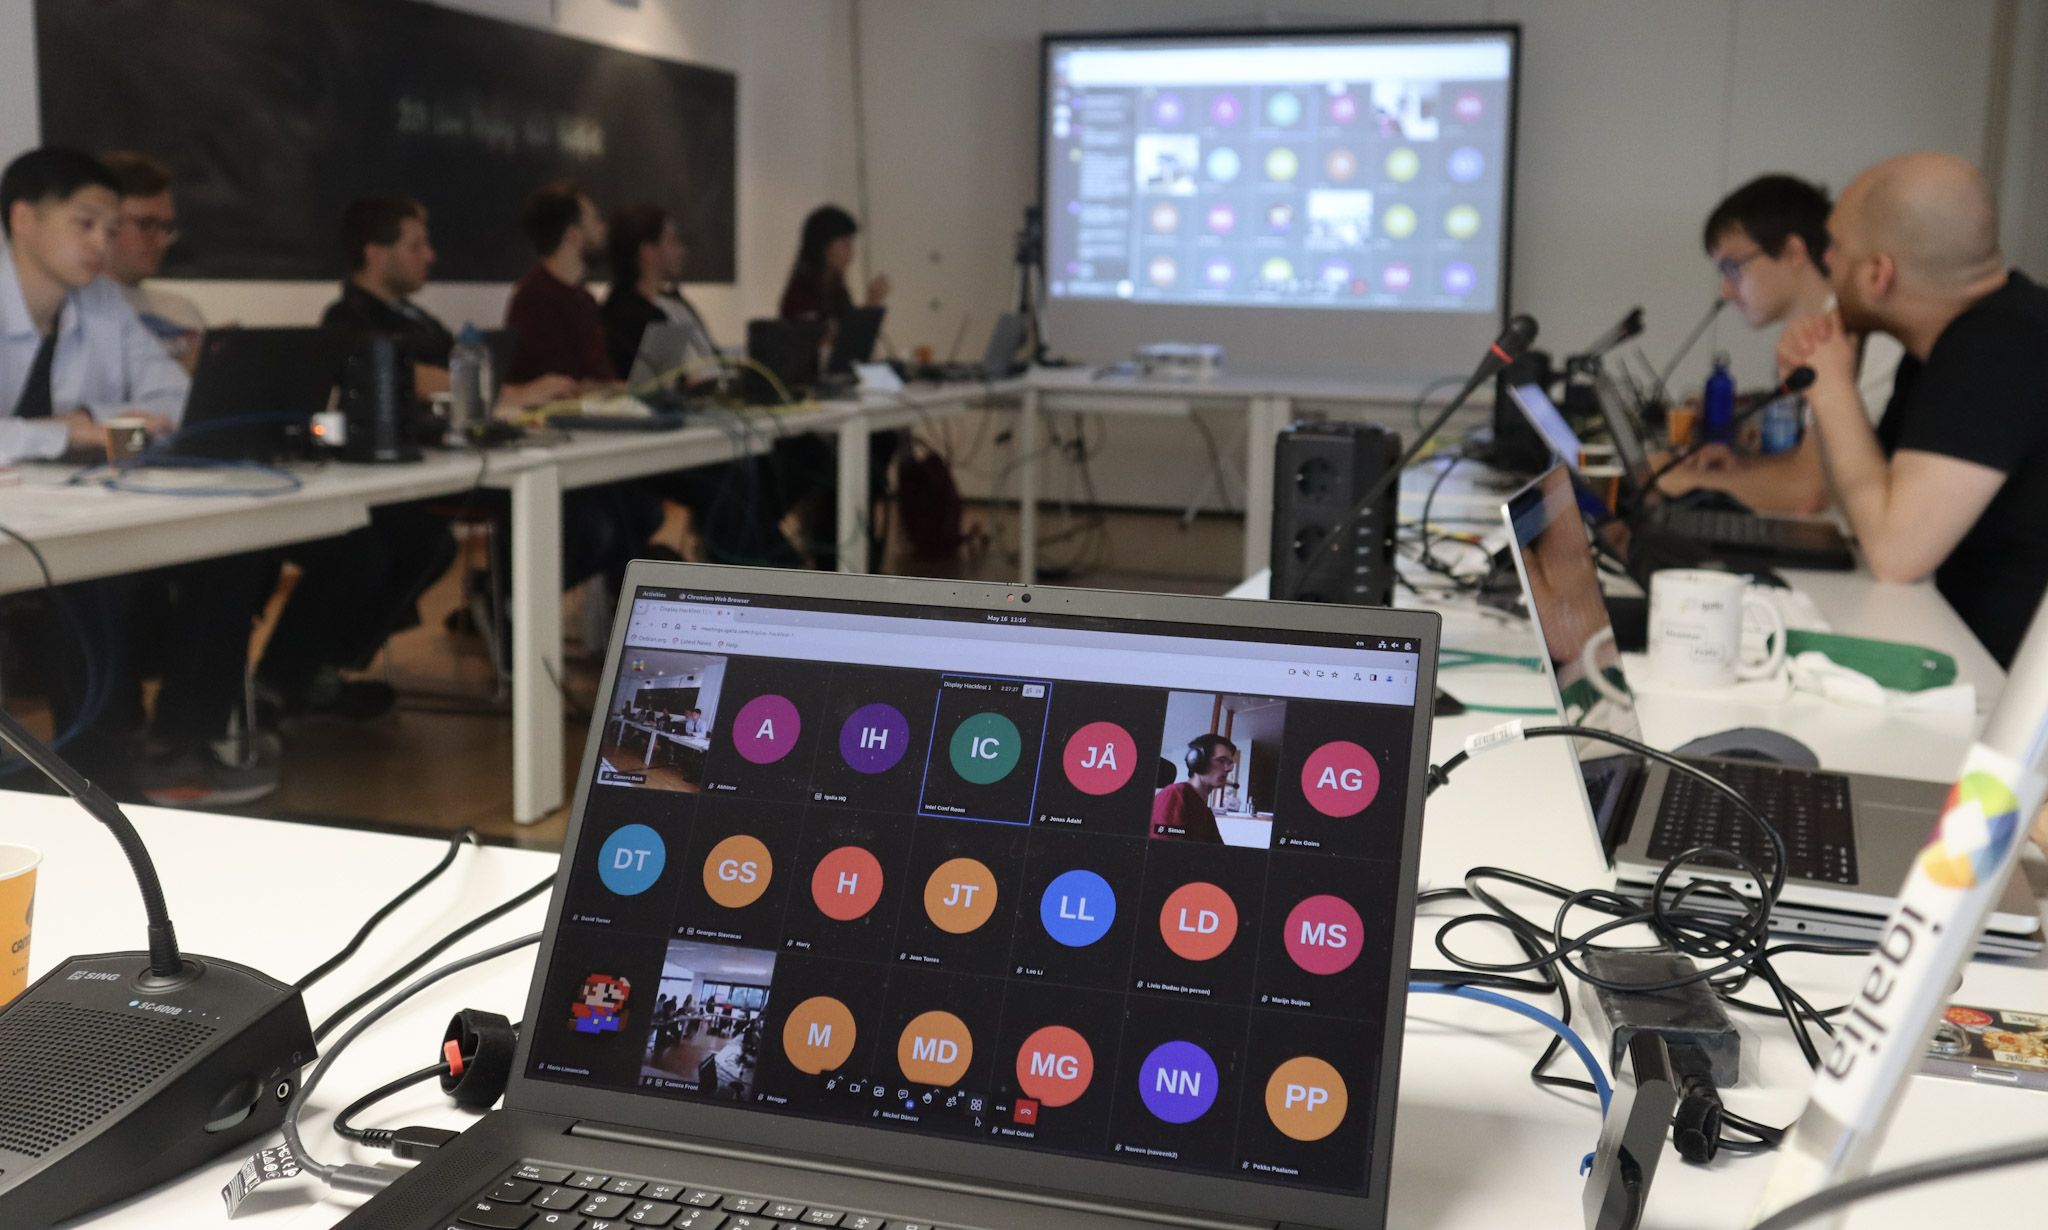
On top of those things, I’ve been also presenting our work around WebKit in different venues, such as in the Embedded Open Source Summit or in the Embedded Recipes conference, for instance. Of course, that included presenting our work in the WebKit community as part of the WebKit Contributors Meeting, a small and technically focused event that happens every year, normally around the Bay Area (California). That’s often a pretty dense presentation where, over the course of 30-40 minutes, we go through all the main areas that we at Igalia contribute to in WebKit, trying to summarize our main contributions in the previous 12 months. This includes work not just from the WebKit team, but also from other ones such as our Web Platform, Compilers or Multimedia teams.
So far I did that a couple of times only, both last year on October 24rth as well as this year, just a couple of weeks ago in the latest instance of the WebKit Contributors meeting. I believe the session was interesting and informative, but unfortunately it does not get recorded so this time I thought I’d write a blog post to make it more widely accessible to people not attending that event.
This is a long read, so maybe grab a cup of your favorite beverage first…
Igalia and WebKit
So first of all, what is the relationship between Igalia and the WebKit project?


In a nutshell, we are the lead developers and the maintainers of the two Linux-based WebKit ports, known as WebKitGTK and WPE. These ports share a common baseline (e.g. GLib, GStreamer, libsoup) and also some goals (e.g. performance, security), but other than that their purpose is different, with WebKitGTK being aimed at the Linux desktop, while WPE is mainly focused on embedded devices.

This means that, while WebKitGTK is the go-to solution to embed Web content in GTK applications (e.g. GNOME Web/Epiphany, Evolution), and therefore integrates well with that graphical toolkit, WPE does not even provide a graphical toolkit since its main goal is to be able to run well on embedded devices that often don’t even have a lot of memory or processing power, or not even the usual mechanisms for I/O that we are used to in desktop computers. This is why WPE’s architecture is designed with flexibility in mind with a backends-based architecture, why it aims for using as few resources as possible, and why it tries to depend on as few libraries as possible, so you can integrate it virtually in any kind of embedded Linux platform.
Besides that port-specific work, which is what our WebKit and Multimedia teams focus a lot of their effort on, we also contribute at a different level in the port-agnostic parts of WebKit, mostly around the area of Web standards (e.g. contributing to Web specifications and to implement them) and the Javascript engine. This work is carried out by our Web Platform and Compilers team, which tirelessly contribute to the different parts of WebCore and JavaScriptCore that affect not just the WebKitGTK and WPE ports, but also the rest of them to a bigger or smaller degree.
Last but not least, we also devote a considerable amount of our time to other topics such as accessibility, performance, bug fixing, QA... and also to make sure WebKit works well on 32-bit devices, which is an important thing for a lot of WPE users out there.
Who are our users?
At Igalia we distinguish 4 main types of users of the WebKitGTK and WPE ports of WebKit:
Port users: this category would include anyone that writes a product directly against the port’s API, that is, apps such as a desktop Web browser or embedded systems that rely on a fullscreen Web view to render its Web-based content (e.g. digital signage systems).
Platform providers: in this category we would have developers that build frameworks with one of the Linux ports at its core, so that people relying on such frameworks can leverage the power of the Web without having to directly interface with the port’s API. RDK could be a good example of this use case, with WPE at the core of the so-called Thunder plugin (previously known as WPEFramework).
Web developers: of course, Web developers willing to develop and test their applications against our ports need to be considered here too, as they come with a different set of needs that need to be fulfilled, beyond rendering their Web content (e.g. using the Web Inspector).
End users: And finally, the end user is the last piece of the puzzle we need to pay attention to, as that’s what makes all this effort a task worth undertaking, even if most of them most likely don’t need what WebKit is, which is perfectly fine :-)
We like to make this distinction of 4 possible types of users explicit because we think it’s important to understand the complexity of the amount of use cases and the diversity of potential users and customers we need to provide service for, which is behind our decisions and the way we prioritize our work.
Strategic goals
Our main goal is that our product, the WebKit web engine, is useful for more and more people in different situations. Because of this, it is important that the platform is homogeneous and that it can be used reliably with all the engines available nowadays, and this is why compatibility and interoperability is a must, and why we work with the the standards bodies to help with the design and implementation of several Web specifications.
With WPE, it is very important to be able to run the engine in small embedded devices, and that requires good performance and being efficient in multiple hardware architectures, as well as great flexibility for specific hardware, which is why we provided WPE with a backend-based architecture, and reduced dependencies to a minimum.
Then, it is also important that the QA Infrastructure is good enough to keep the releases working and with good quality, which is why I regularly maintain, evolve and keep an eye on the EWS and post-commit bots that keep WebKitGTK and WPE building, running and passing the tens of thousands of tests that we need to check continuously, to ensure we don’t regress (or that we catch issues soon enough, when there’s a problem). Then of course it’s also important to keep doing security releases, making sure that we release stable versions with fixes to the different CVEs reported as soon as possible.
Finally, we also make sure that we keep evolving our tooling as much as possible (see for instance the release of the new SDK earlier this year), as well as improving the documentation for both ports.
Last, all this effort would not be possible if not because we also consider a goal of us to maintain an efficient collaboration with the rest of the WebKit community in different ways, from making sure we re-use and contribute to other ports as much code as possible, to making sure we communicate well in all the forums available (e.g. Slack, mailing list, annual meeting).
Contributions to WebKit in numbers
Well, first of all the usual disclaimer: number of commits is for sure not the best possible metric, and therefore should be taken with a grain of salt. However, the point here is not to focus too much on the actual numbers but on the more general conclusions that can be extracted from them, and from that point of view I believe it’s interesting to take a look at this data at least once a year.

With that out of the way, it’s interesting to confirm that once again we are still the 2nd biggest contributor to WebKit after Apple, with ~13% of the commits landed in this past 12-month period. More specifically, we landed 2027 patches out of the 15617 ones that took place during the past year, only surpassed by Apple and their 12456 commits. The remaining 1134 patches were landed mostly by Sony, followed by RedHat and several other contributors.
 Now, if we remove Apple from the picture, we can observe how this year our contributions represented ~64% of all the non-Apple commits, a figure that grew about ~11% compared to the past year. This confirms once again our commitment to WebKit, a project we started contributing about 14 years ago already, and where we have been systematically being the 2nd top contributor for a while now.
Main areas of work
The 10 main areas we have contributed to in WebKit in the past 12 months are the following ones:
- Web platform
- Graphics
- Multimedia
- JavaScriptCore
- New WPE API
- WebKit on Android
- Quality assurance
- Security
- Tooling
- Documentation
In the next sections I’ll talk a bit about what we’ve done and what we’re planning to do next for each of them.
Web Platform
content-visibility:auto
This feature allows skipping painting and rendering of off-screen sections, particularly useful to avoid the browser spending time rendering parts in large pages, as content outside of the view doesn’t get rendered until it gets visible.
We completed the implementation and it’s now enabled by default.
Navigation API
This is a new API to manage browser navigation actions and examine history, which we started working on in the past cycle. There’s been a lot of work happening here and, while it’s not finished yet, the current plan is that Apple will continue working on that in the next months.
hasUAVisualTransition
This is an attribute of the NavigateEvent interface, which is meant to be True if the User Agent has performed a visual transition before a navigation event. It was something that we have also finished implementing and is now also enabled by default.
Secure Curves in the Web Cryptography API
In this case, we worked on fixing several Web Interop related issues, as well as on increasing test coverage within the Web Platform Tests (WPT) test suites.
On top of that we also moved the X25519 feature to the “prepare to ship” stage.
Trusted Types
This work is related to reducing DOM-based XSS attacks. Here we finished the implementation and this is now pending to be enabled by default.
MathML
We continued working on the MathML specification by working on the support for padding, border and margin, as well as by increasing the WPT score by ~5%.
The plan for next year is to continue working on core features and improve the interaction with CSS.
Cross-root ARIA
Web components have accessibility-related issues with native Shadow DOM as you cannot reference elements with ARIA attributes across boundaries. We haven’t worked on this in this period, but the plan is to work in the next months on implementing the Reference Target proposal to solve those issues.
Canvas Formatted Text
Canvas has not a solution to add formatted and multi-line text, so we would like to also work on exploring and prototyping the Canvas Place Element proposal in WebKit, which allows better text in canvas and more extended features.
Graphics
Completed migration from Cairo to Skia for the Linux ports
If you have followed the latest developments, you probably already know that the Linux WebKit ports (i.e. WebKitGTK and WPE) have moved from Cairo to Skia for their 2D rendering library, which was a pretty big and important decision taken after a long time trying different approaches and experiments (including developing our own HW-accelerated 2D rendering library!), as well as running several tests and measuring results in different benchmarks.
 The results in the end were pretty overwhelming and we decided to give Skia a go, and we are happy to say that, as of today, the migration has been completed: we covered all the use cases in Cairo, achieving feature parity, and we are now working on implementing new features and improvements built on top of Skia (e.g. GPU-based 2D rendering).
On top of that, Skia is now the default backend for WebKitGTK and WPE since 2.46.0, released on September 17th, so if you’re building a recent version of those ports you’ll be already using Skia as their 2D rendering backend. Note that Skia is using its GPU-based backend only on desktop environments, on embedded devices the situation is trickier and for now the default is the CPU-based Skia backend, but we are actively working to narrow the gap and to enable GPU-based rendering also on embedded.
Architecture changes with buffer sharing APIs (DMABuf)
We did a lot of work here, such as a big refactoring of the fencing system to control the access to the buffers, or the continued work towards integrating with Apple’s DisplayLink infrastructure.
On top of that, we also enabled more efficient composition using damaging information, so that we don’t need to pass that much information to the compositor, which would slow the CPU down.
Enablement of the GPUProcess
On this front, we enabled by default the compilation for WebGL rendering using the GPU process, and we are currently working in performance review and enabling it for other types of rendering.
New SVG engine (LBSE: Layer-Based SVG Engine)
If you are not familiar with this, here the idea is to make sure that we reuse the graphics pipeline used for HTML and CSS rendering, and use it also for SVG, instead of having its own pipeline. This means, among other things, that SVG layers will be supported as a 1st-class citizen in the engine, enabling HW-accelerated animations, as well as support for 3D transformations for individual SVG elements.

On this front, on this cycle we added support for the missing features in the LBSE, namely:
- Implemented support for gradients & patterns (applicable to both fill and stroke)
- Implemented support for clipping & masking (for all shapes/text)
- Implemented support for markers
- Helped review implementation of SVG filters (done by Apple)
Besides all this, we also improved the performance of the new layer-based engine by reducing repaints and re-layouts as much as possible (further optimizations still possible), narrowing the performance gap with the current engine for MotionMark. While we are still not at the same level of performance as the current SVG engine, we are confident that there are several key places where, with the right funding, we should be able to improve the performance to at least match the current engine, and therefore be able to push the new engine through the finish line.
General overhaul of the graphics pipeline, touching different areas (WIP):
On top of everything else commented above, we also worked on a general refactor and simplification of the graphics pipeline. For instance, we have been working on the removal of the Nicosia layer now that we are not planning to have multiple rendering implementations, among other things.
Multimedia
DMABuf-based sink for HW-accelerated video
We merged the DMABuf-based sink for HW-accelerated video in the GL-based GStreamer sink.
WebCodecs backend
We completed the implementation of audio/video encoding and decoding, and this is now enabled by default in 2.46. As for the next steps, we plan to keep working on the integration of WebCodecs with WebGL and WebAudio.
GStreamer-based WebRTC backends
We continued working on GstWebRTC, bringing it to a point where it can be used in production in some specific use cases, and we will still be working on this in the next months.
Other
Besides the points above, we also added an optional text-to-speech backend based on libspiel to the development branch, and worked on general maintenance around the support for Media Source Extensions (MSE) and Encrypted Media Extensions (EME), which are crucial for the use case of WPE running in set-top-boxes, and is a permanent task we will continue to work on in the next months.
JavaScriptCore
ARMv7/32-bit support:
A lot of work happened around 32-bit support in JavaScriptCore, especially around WebAssembly (WASM): we ported the WASM BBQJIT and ported/enabled concurrent JIT support, and we also completed 80% of the implementation for the OMG optimization level of WASM, which we plan to finish in the next months. If you are unfamiliar with what the OMG and BBQ optimization tiers in WASM are, I’d recommend you to take a look at this article in webkit.org: “Assembling WebAssembly“.
 We also contributed to the JIT-less WASM, which is very useful for embedded systems that can’t support JIT for security or memory related constraints, and also did some work on the In-Place Interpreter (IPInt), which is a new version of the WASM Low-level interpreter (LLInt) that uses less memory and executes WASM bytecode directly without translating it to LLInt bytecode (and should therefore be faster to execute).
Last, we also contributed most of the implementation for the WASM GC, with the exception of some Kotlin tests.
As for the next few months, we plan to investigate and optimize heap/JIT memory usage in 32-bit, as well as to finish several other improvements on ARMv7 (e.g. IPInt).
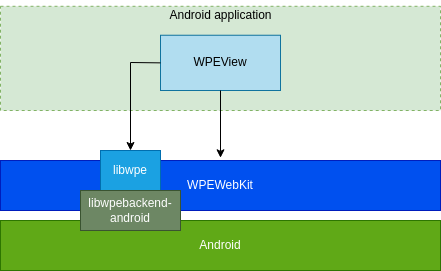
New WPE API
The new WPE API is a new API that aims at making it easier to use WPE in embedded devices, by removing the hassle of having to handle several libraries in tandem (i.e. WPEWebKit, libWPE and WPEBackend-FDO, for instance), available from WPE’s releases page, and providing a more modern API in general, better aimed at the most common use cases of WPE.
A lot of effort happened this year along these lines, including the fact that we finally upstreamed and shipped its initial implementation with WPE 2.44, back in the first half of the year. Now, while we recommend users to give it a try and report feedback as much as possible, this new API is still not set in stone, with regular development still ongoing, so if you have the chance to try it out and share your experience, comments are welcome!
Besides shipping its initial implementation, we also added support for external platforms, so that other ones can be loaded beyond the Wayland, DRM and “headless” ones, which are the default platforms already included with WPE itself. This means for instance that a GTK4 platform, or another one for RDK could be easily used with WPE.
Then of course a lot of API additions were included in the new API in the latest months:
- Screens management API: API to handle different screens, ask the display for the list of screens with their device scale factor, refresh rate, geometry…
- Top level management API: This API allows a greater degree of control, for instance by allowing more than one WebView for the same top level, as well as allowing to retrieve properties such as size, scale or state (i.e. full screen, maximized…).
- Maximized and minimized windows API: API to maximize/minimize a top level and monitor its state. mainly used by WebDriver.
- Preferred DMA-BUF formats API: enables asking the platform (compositor or DRM) for the list of preferred formats and their intended use (scanout/rendering).
- Input methods API: allows platforms to provide an implementation to handle input events (e.g. virtual keyboard, autocompletion, auto correction…).
- Gestures API: API to handle gestures (e.g. tap, drag).
- Buffer damaging: WebKit generates information about the areas of the buffer that actually changed and we pass that to DRM or the compositor to optimize painting.
- Pointer lock API: allows the WebView to lock the pointer so that the movement of the pointing device (e.g. mouse) can be used for a different purpose (e.g. first-person shooters).
Last, we also added support for testing automation, and we can support WebDriver now in the new API.
With all this done so far, the plan now is to complete the new WPE API, with a focus on the Settings API and accessibility support, write API tests and documentation, and then also add an external platform to support GTK4. This is done on a best-effort basis, so there’s no specific release date.
WebKit on Android
This year was also a good year for WebKit on Android, also known as WPE Android, as this is a project that sits on top of WPE and its public API (instead of developing a fully-fledged WebKit port).
 In case you’re not familiar with this, the idea here is to provide a WebKit-based alternative to the Chromium-based Web view on Android devices, in a way that leverages HW acceleration when possible and that it integrates natively (and nicely) with the several Android subsystems, and of course with Android’s native mainloop. Note that this is an experimental project for now, so don’t expect production-ready quality quite yet, but hopefully something that can be used to start experimenting with selected use cases.
If you’re adventurous enough, you can already try the APKs yourself from the releases page in GitHub at https://github.com/Igalia/wpe-android/releases.
Anyway, as for the changes that happened in the past 12 months, here is a summary:
- Updated WPE Android to WPE 2.46 and NDK 27 LTS
- Added support for WebDriver and included WPT test suites
- Added support for instrumentation tests, and integrated with the GitHub CI
- Added support for the remote Web inspector, very useful for debugging
- Enabled the Skia backend, bringing HW-accelerated 2D rendering to WebKit on Android
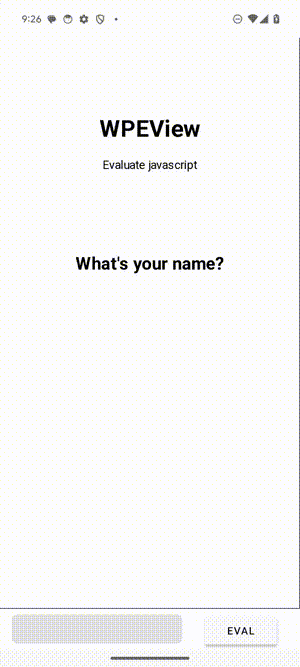
- Implemented prompt delegates, allowing implementing things such as alert dialogs
- Implemented WPEView client interfaces, allowing responding to things such as HTTP errors
- Packaged a WPE-based Android WebView in its own library and published in Maven Central. This is a massive improvement as now apps can use WPE Android by simply referencing the library from the gradle files, no need to build everything on their own.
- Other changes: enabled HTTP/2 support (via the migration to libsoup3), added support for the device scale factor, improved the virtual on-screen keyboard, general bug fixing…
On top of that, we published 3 different blog posts covering different topics, from a general intro to a more deep dive explanation of the internals, and showing some demos. You can check them out in Jani’s blog at https://blogs.igalia.com/jani
As for the future, we’ll focus on stabilization and regular maintenance for now, and then we’d like to work towards achieving production-ready quality for specific cases if possible.
Quality Assurance
On the QA front, we had a busy year but in general we could highlight the following topics.
- Fixed a lot of API tests failures in the bots that were limiting our test coverage.
- Fixed lots of assertions-related crashes in the bots, which were slowing down the bots as well as causing other types of issues, such as bots exiting early due too many failures.
- Enabled assertions in the release bots, which will help prevent crashes in the future, as well as with making our debug bots healthier.
- Moved all the WebKitGTK and WPE bots to building now with Skia instead of Cairo. This means that all the bots running tests are now using Skia, and there’s only one bot still using Cairo to make sure that the compilation is not broken, but that bot does not run tests.
- Moved all the WebKitGTK bots to use GTK4 by default. As with the move to Skia, all the WebKit bots running tests now use GTK4 and the only one remaining building with GTK3 does not run tests, it only makes sure we don’t break the GTK3 compilation for now.
- Working on moving all the bots to use the new SDK. This is still work in progress and will likely be completed during 2025 as it’s needed to implement several changes in the infrastructure that will take some time.
- General gardening and bot maintenance
In the next months, our main focus would be a revamp of the QA infrastructure to make sure that we can get all the bots (including the debug ones) to a healthier state, finish the migration of all the bots to the new SDK and, ideally, be able to bring back the ready-to-use WPE images that we used to have available in wpewebkit.org.
Security
The current release cadence has been working well, so we continue issuing major releases every 6 months (March, September), and then minor and unstable development releases happening on-demand when needed.
As usual, we kept aligning releases for WebKitGTK and WPE, with both of them happening at the same time (see https://webkitgtk.org/releases and https://wpewebkit.org/release), and then also publishing WebKit Security Advisories (WSA) when necessary, both for WebKitGTK and for WPE.
Last, we also shortened the time before including security fixes in stable releases this year, and we have removed support for libsoup2 from WPE, as that library is no longer maintained.
Tooling & Documentation
On tooling, the main piece of news is that this year we released the initial version of the new SDK, which is developed on top of OCI-based containers. This new SDK fixes the issues with the current existing approaches based on JHBuild and flatpak, where one of them was great for development but poor for testing and QA, and the other one was great for testing and QA, but not very convenient for development.
This new SDK is regularly maintained and currently runs on Ubuntu 24.04 LTS with GCC 14 & Clang 18. It has been made public on GitHub and announced to the public in May 2024 in Patrick’s blog, and is now the officially recommended way of building WebKitGTK and WPE.
As for documentation, we didn’t do as much as we would have liked here, but we still landed a few contributions in docs.webkit.org, mostly related to WebKitGTK (e.g. Releases and Versioning, Security Updates, Multimedia). We plan to do more on this regard in the next months, though, mostly by writing/publishing more documentation and perhaps also some tutorials.
Final thoughts
This has been a fairly long blog post but, as you can see, it’s been quite a year for WebKit here at Igalia, with many exciting changes happening at several fronts, and so there was quite a lot of stuff to comment on here. This said, you can always check the slides of the presentation in the WebKit Contributors Meeting here if you prefer a more concise version of the same content.
In any case, what’s clear it’s that the next months are probably going to be quite interesting as well with all the work that’s already going on in WebKit and its Linux ports, so it’s possible that in 12 months from now I might be writing an equally long essay. We’ll see.
Thanks for reading!
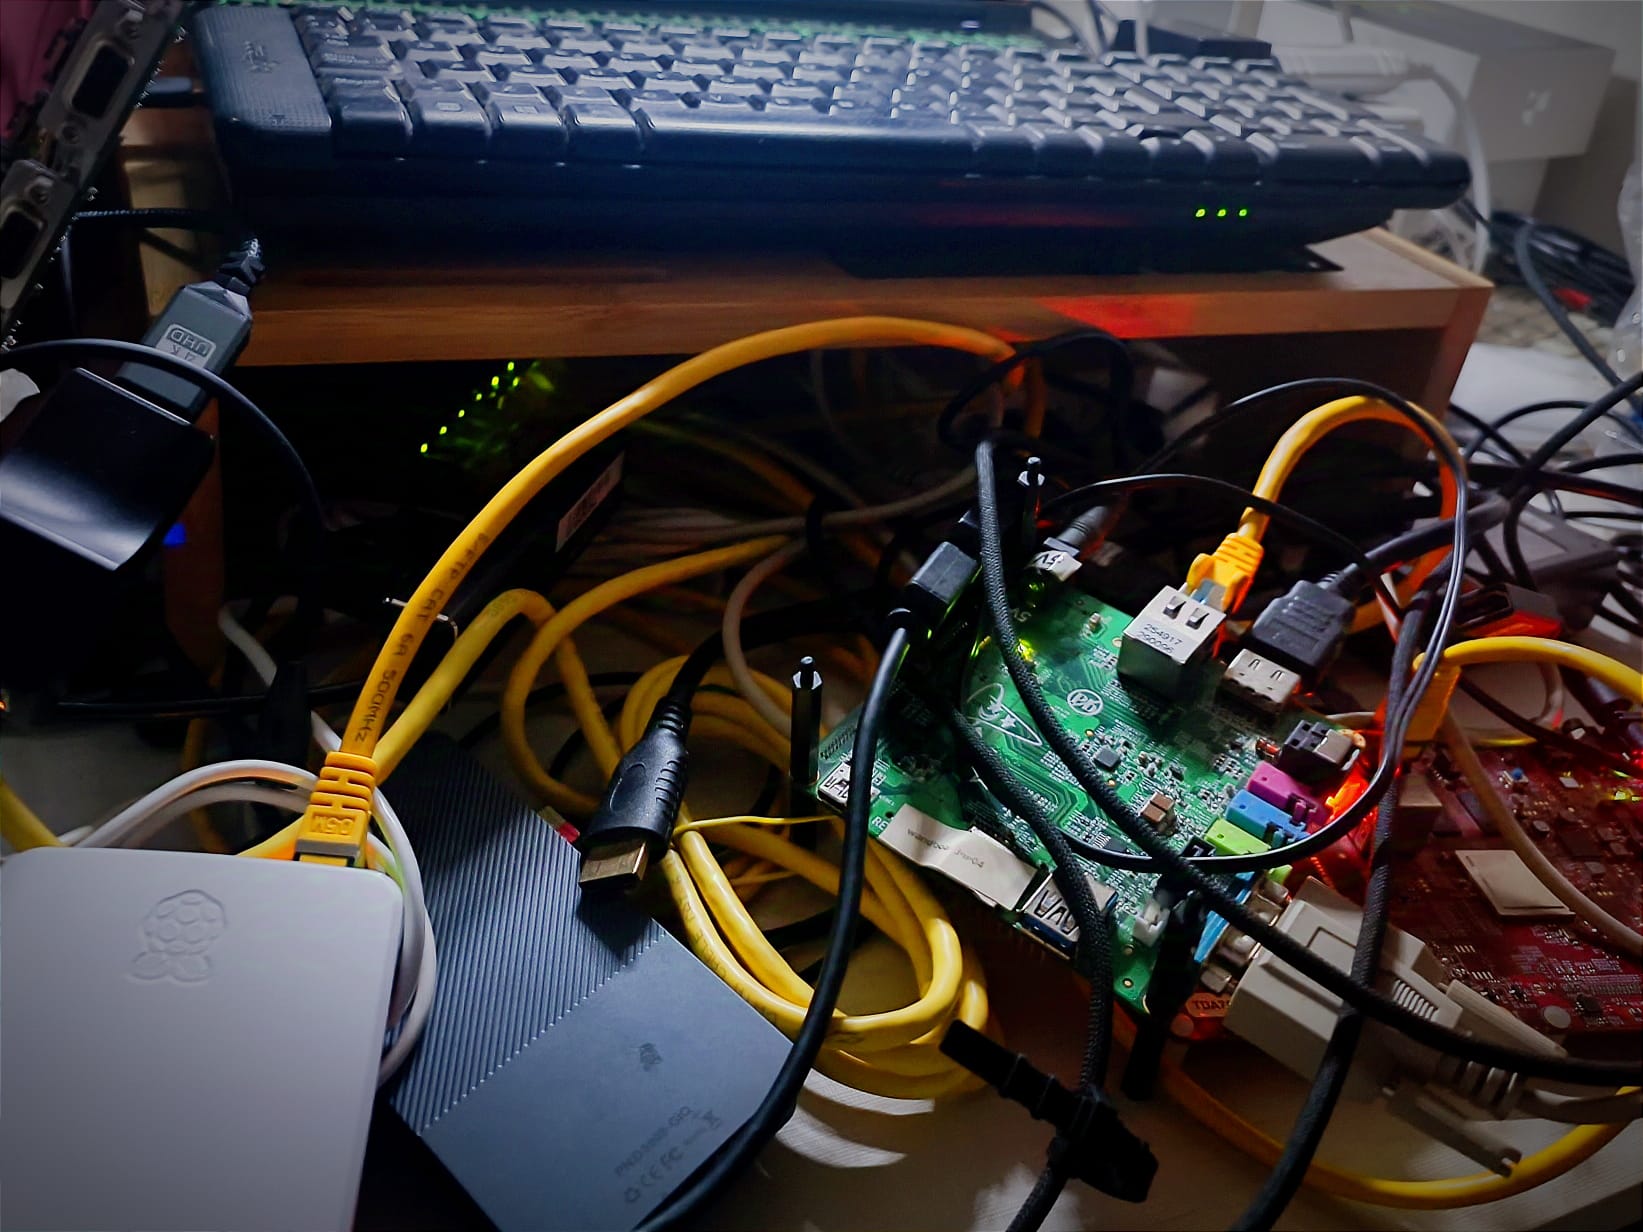

 Disclaimer: This solution has a notable limitation. The design does not enable remote management of peripherals. This is not a major issue for me, as I usually don’t need to interact extensively with the display. However, in cases where interaction is necessary, I mitigate this limitation by using
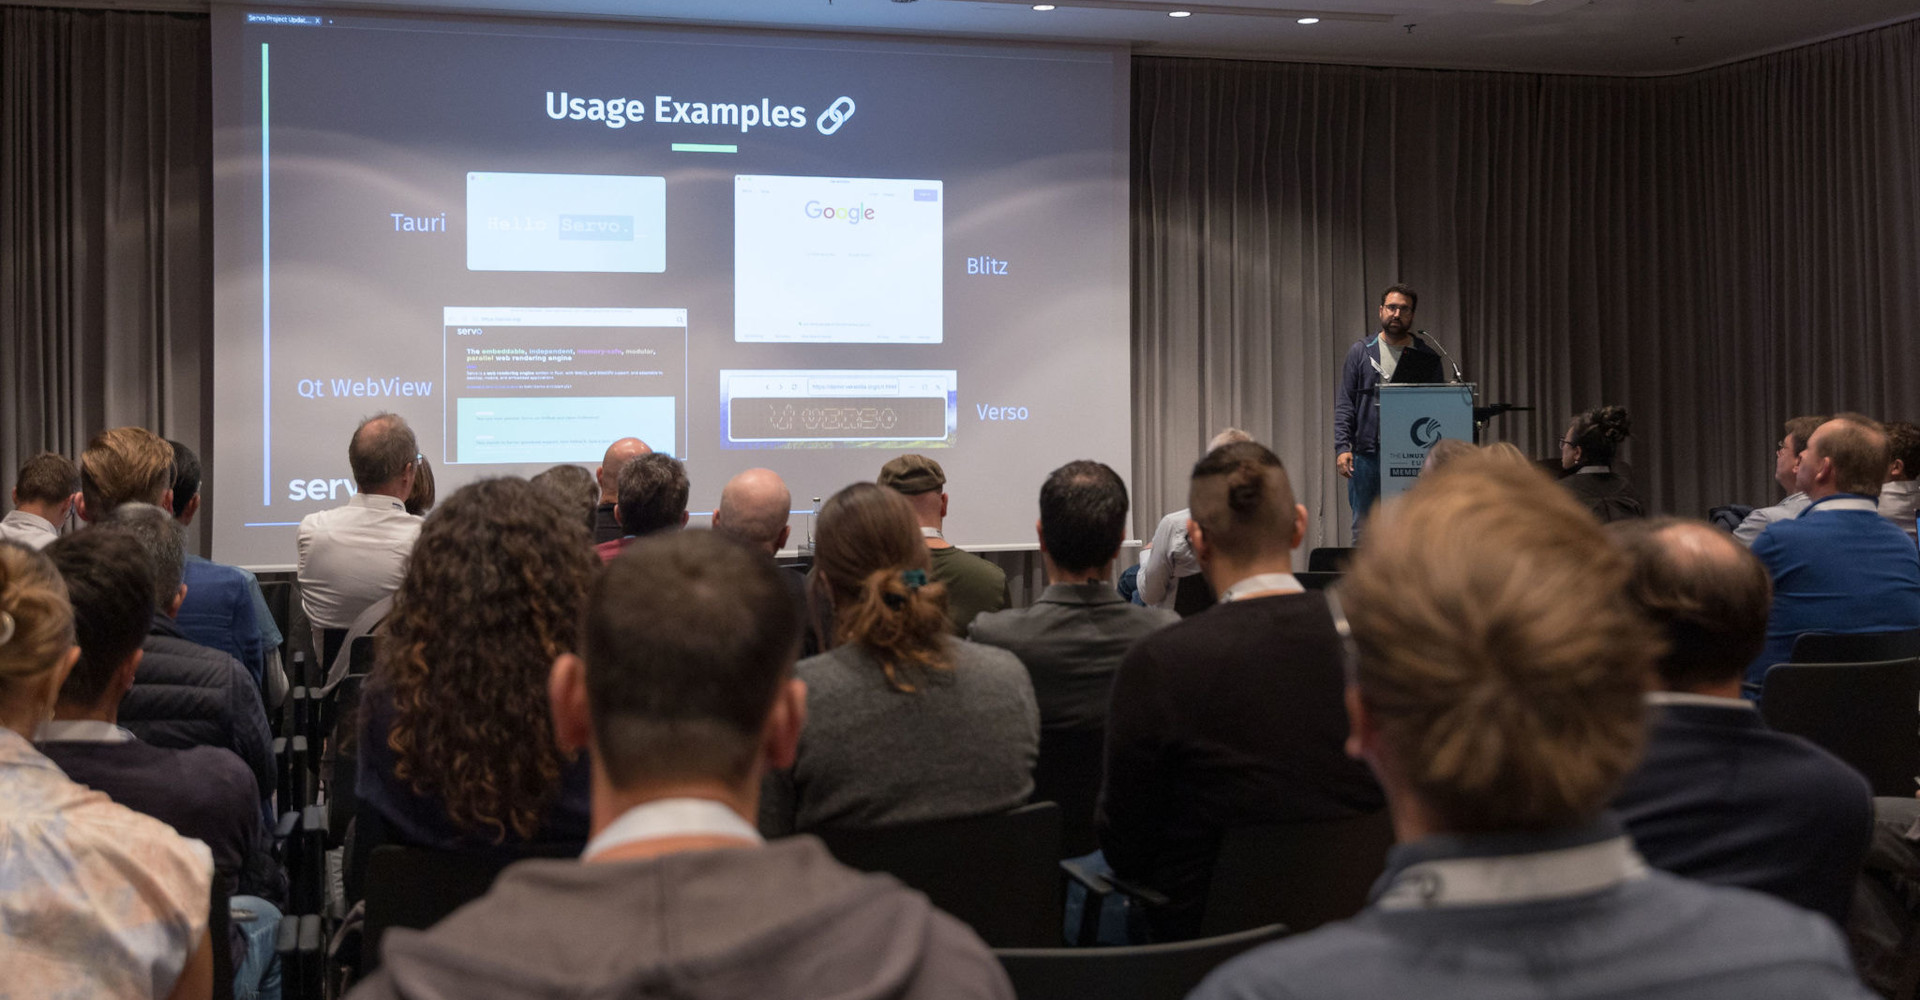 Servo Project Updates talk at Linux Foundation Europe Member Summing 2024 (
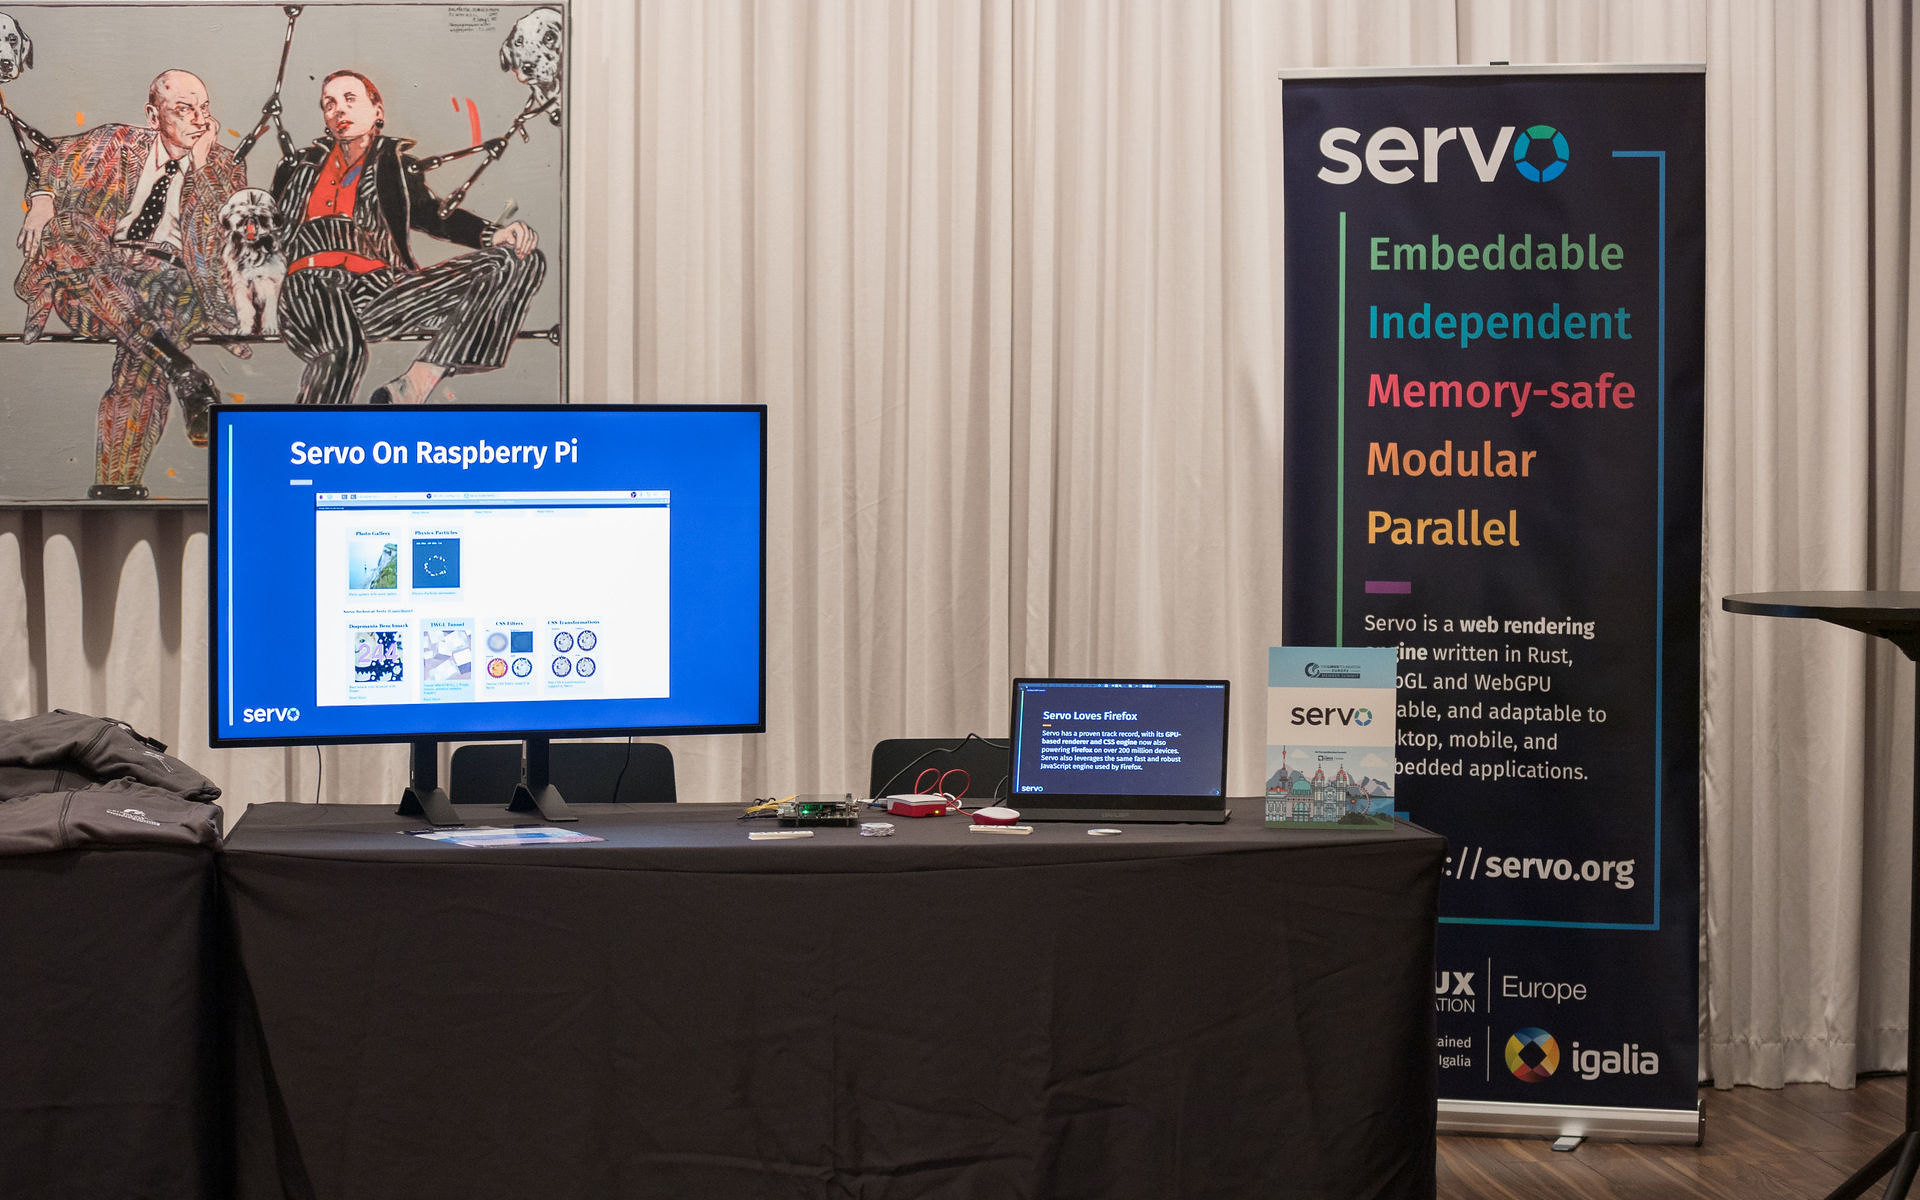 Servo booth at Linux Foundation Europe Member Summing 2024 (
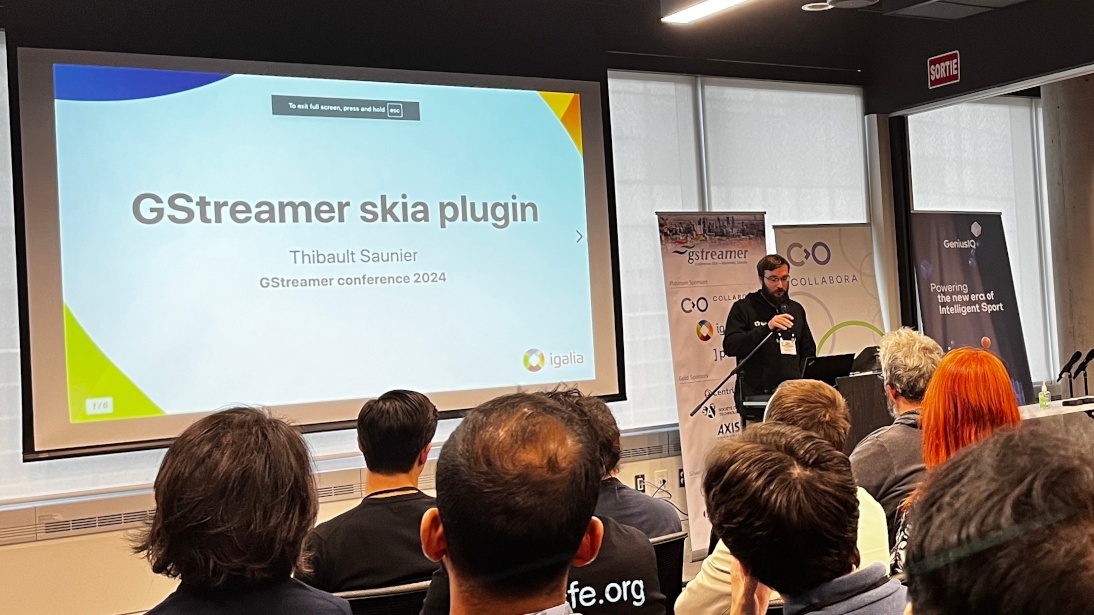 GStreamer Skia plugin
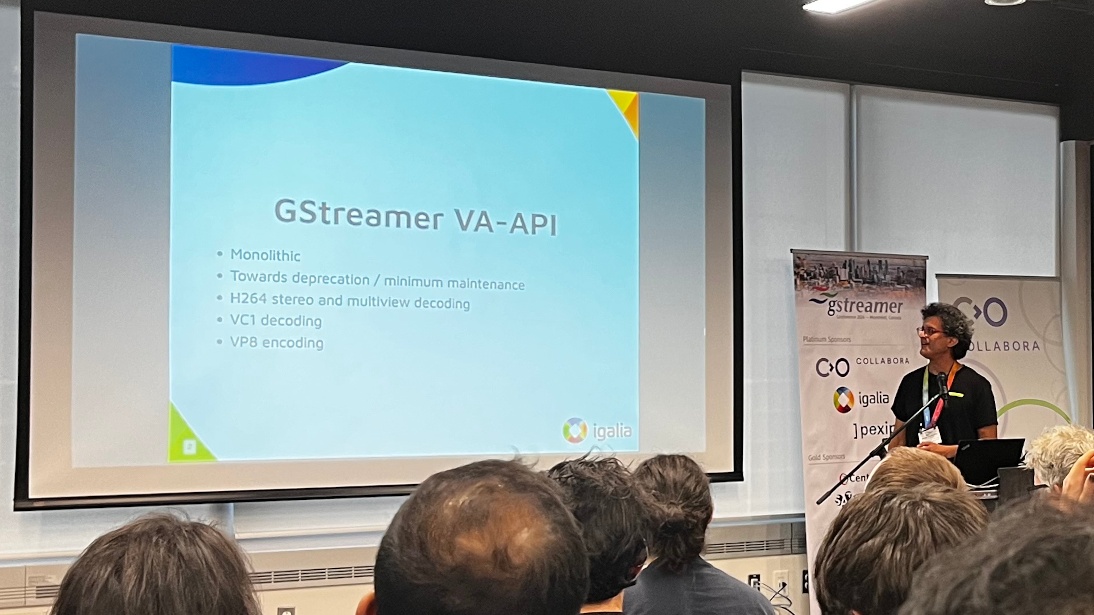 GStreamer VA
 GstWebRTC
 GstVulkan
 gstreamer editing services


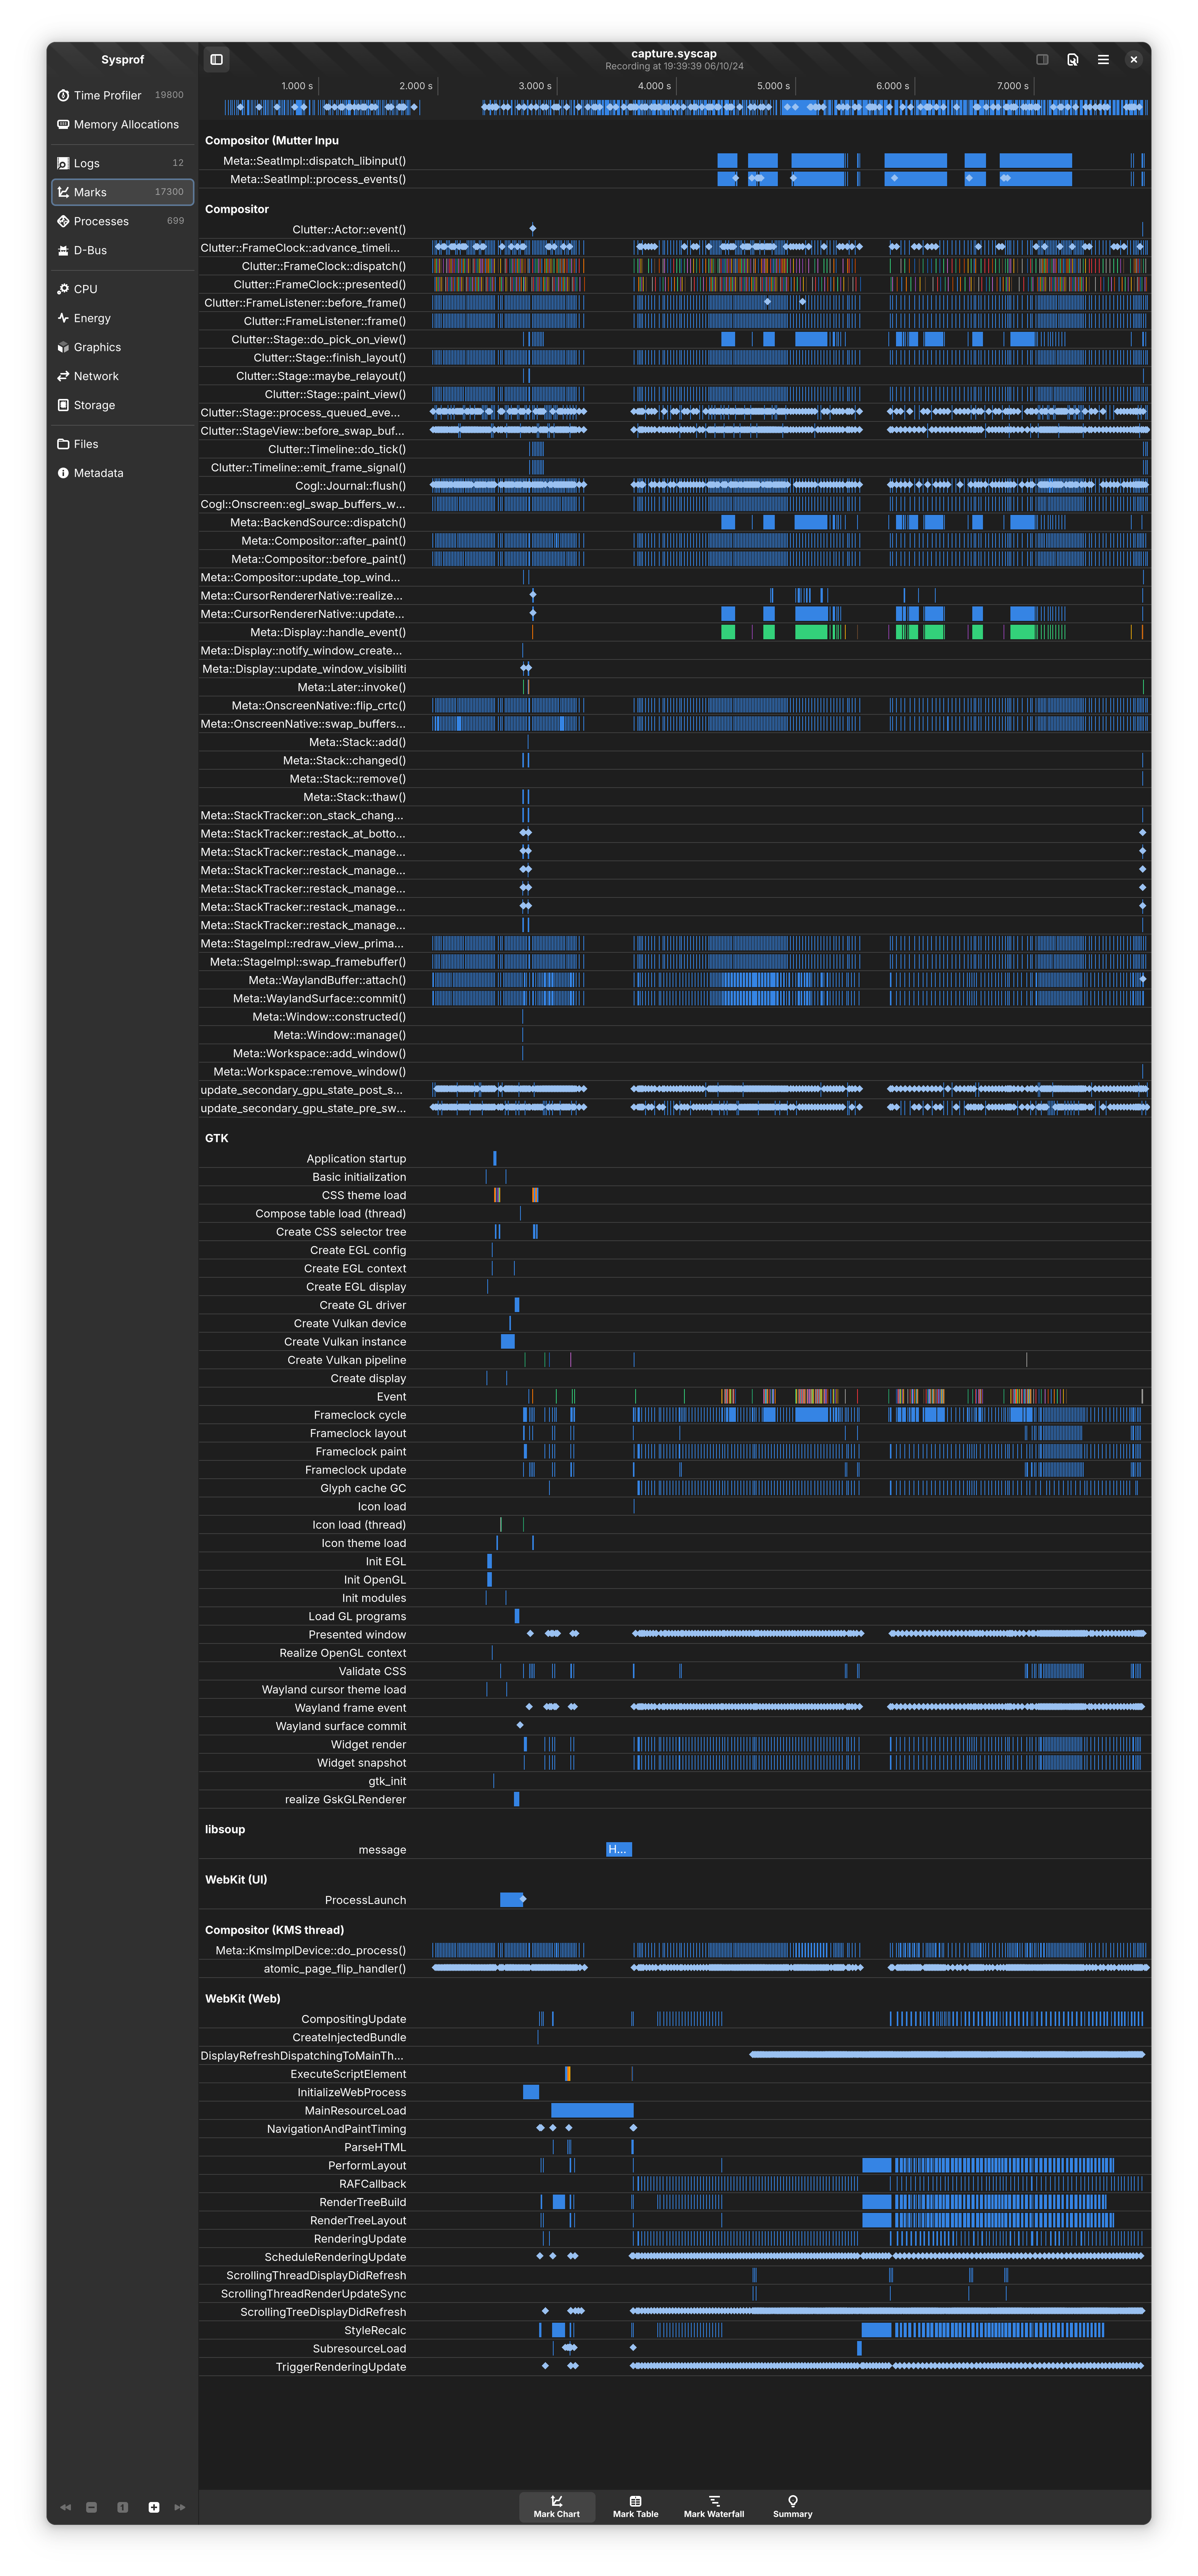
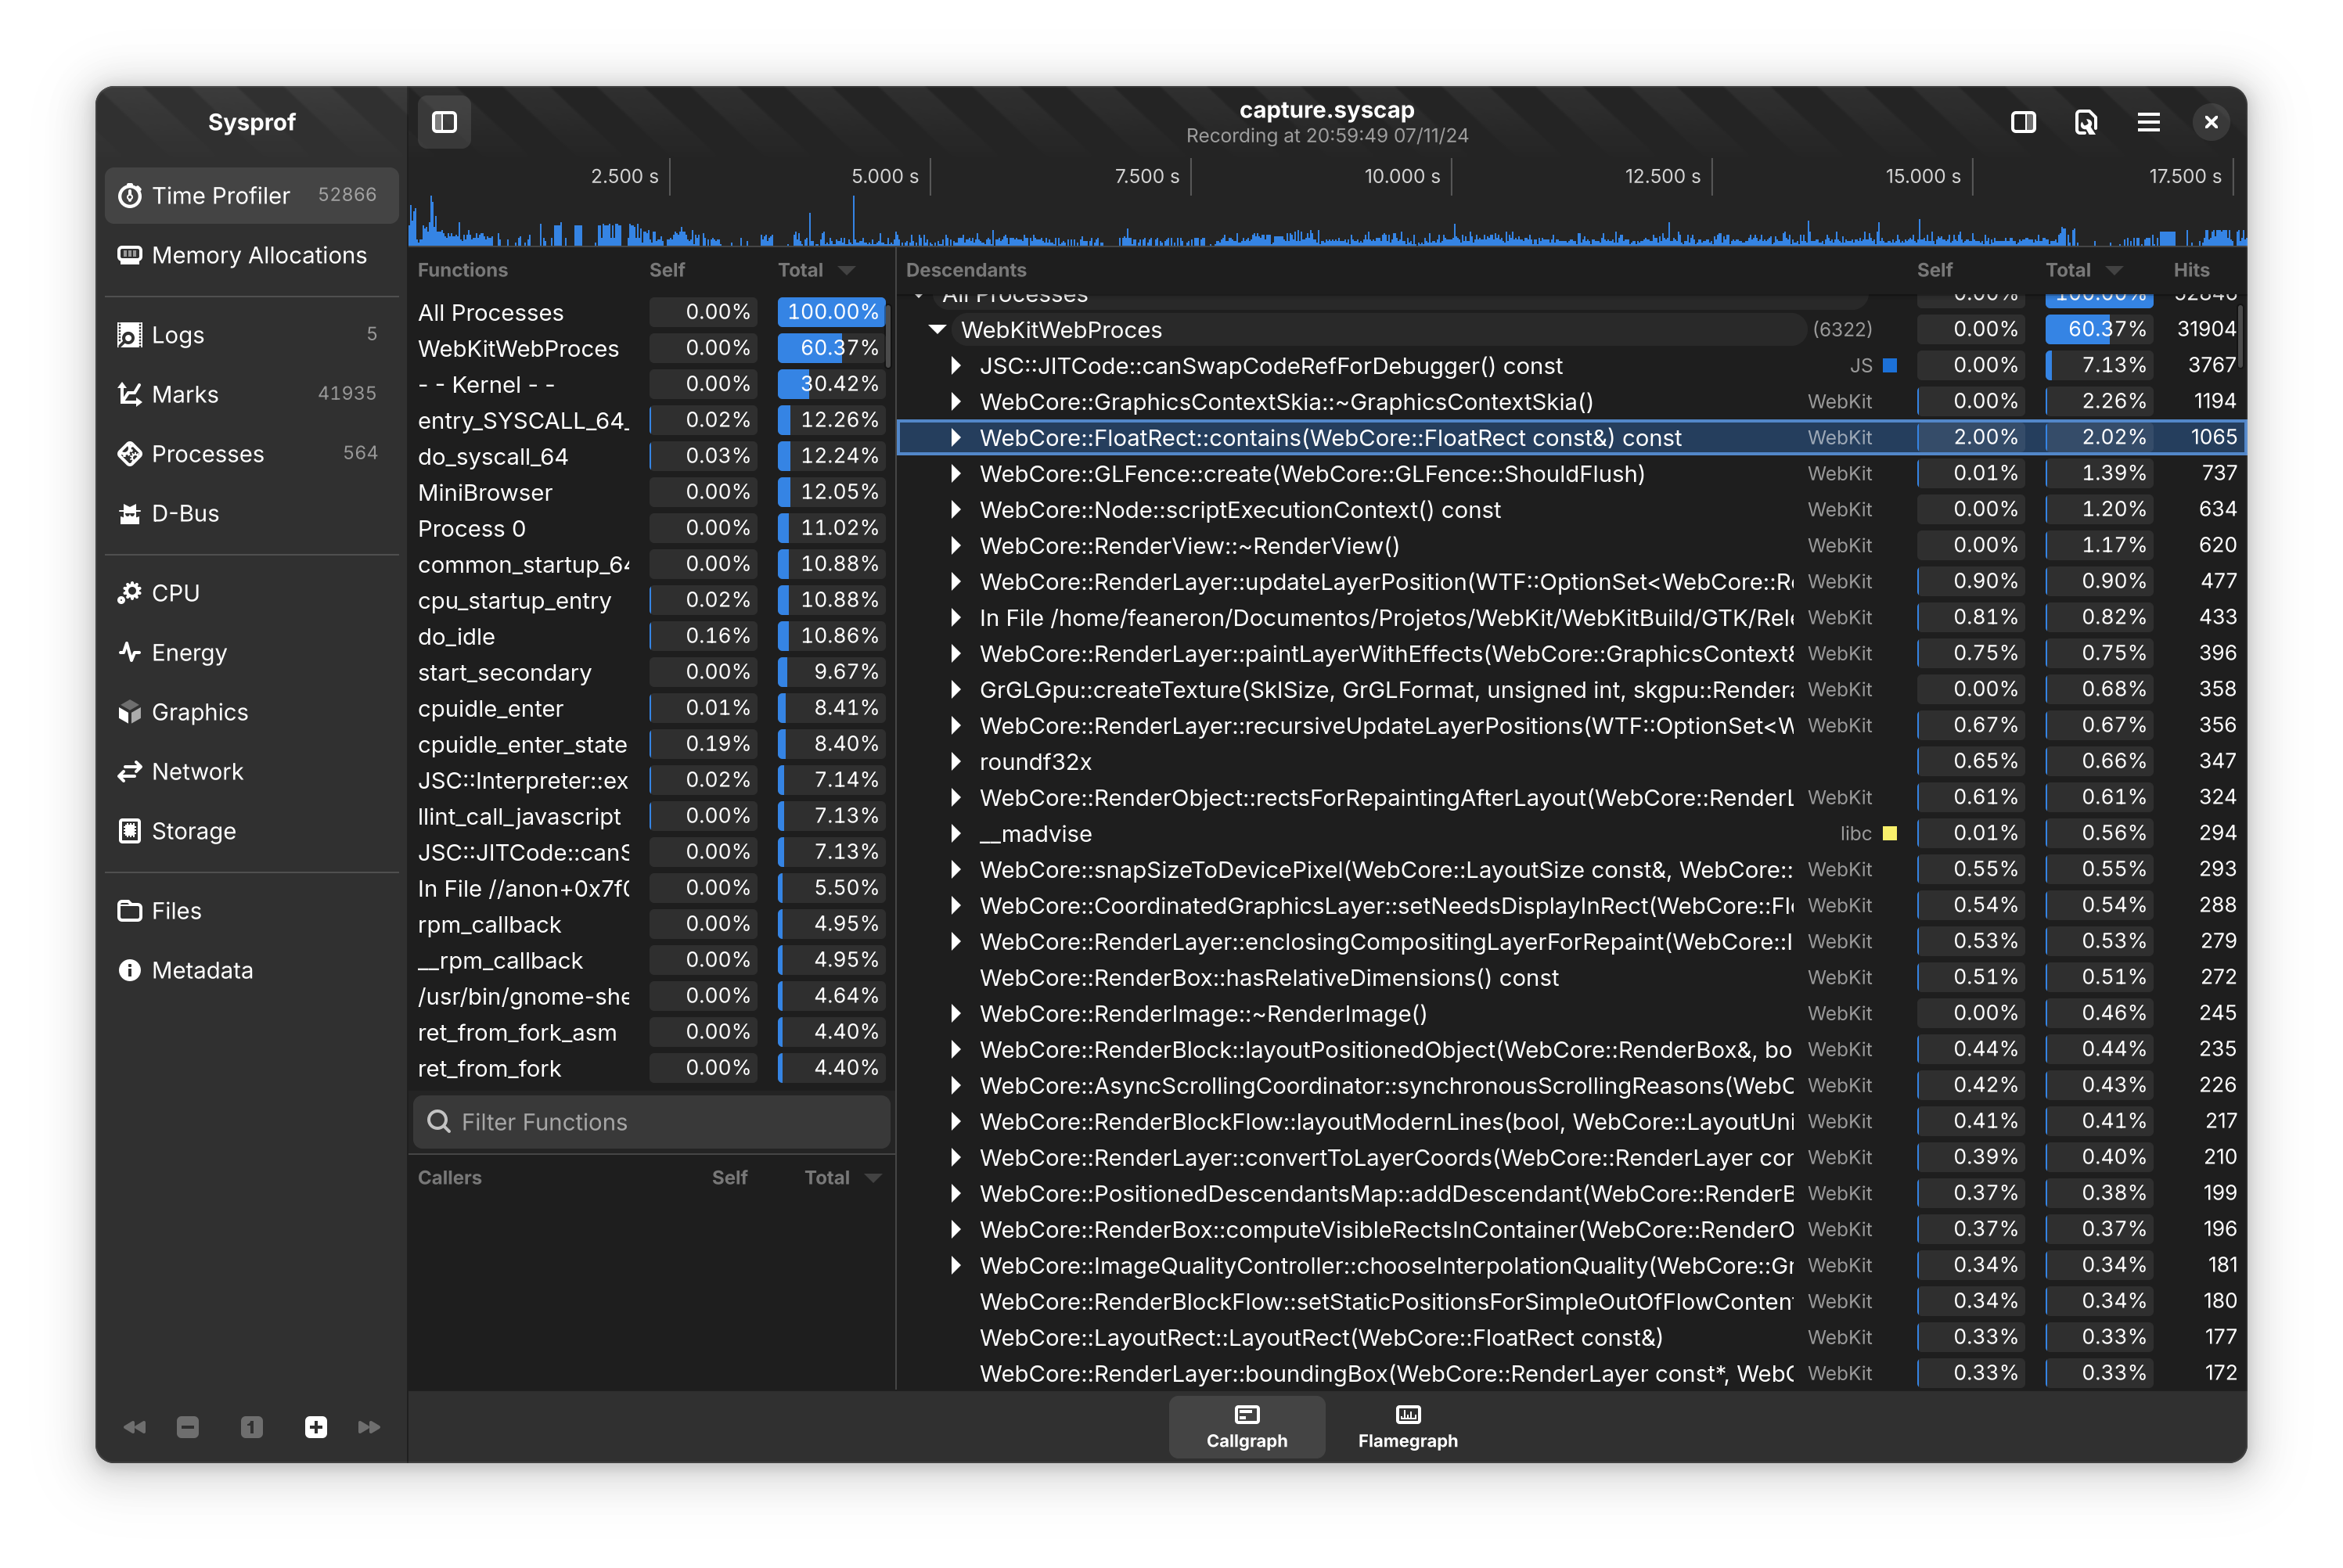
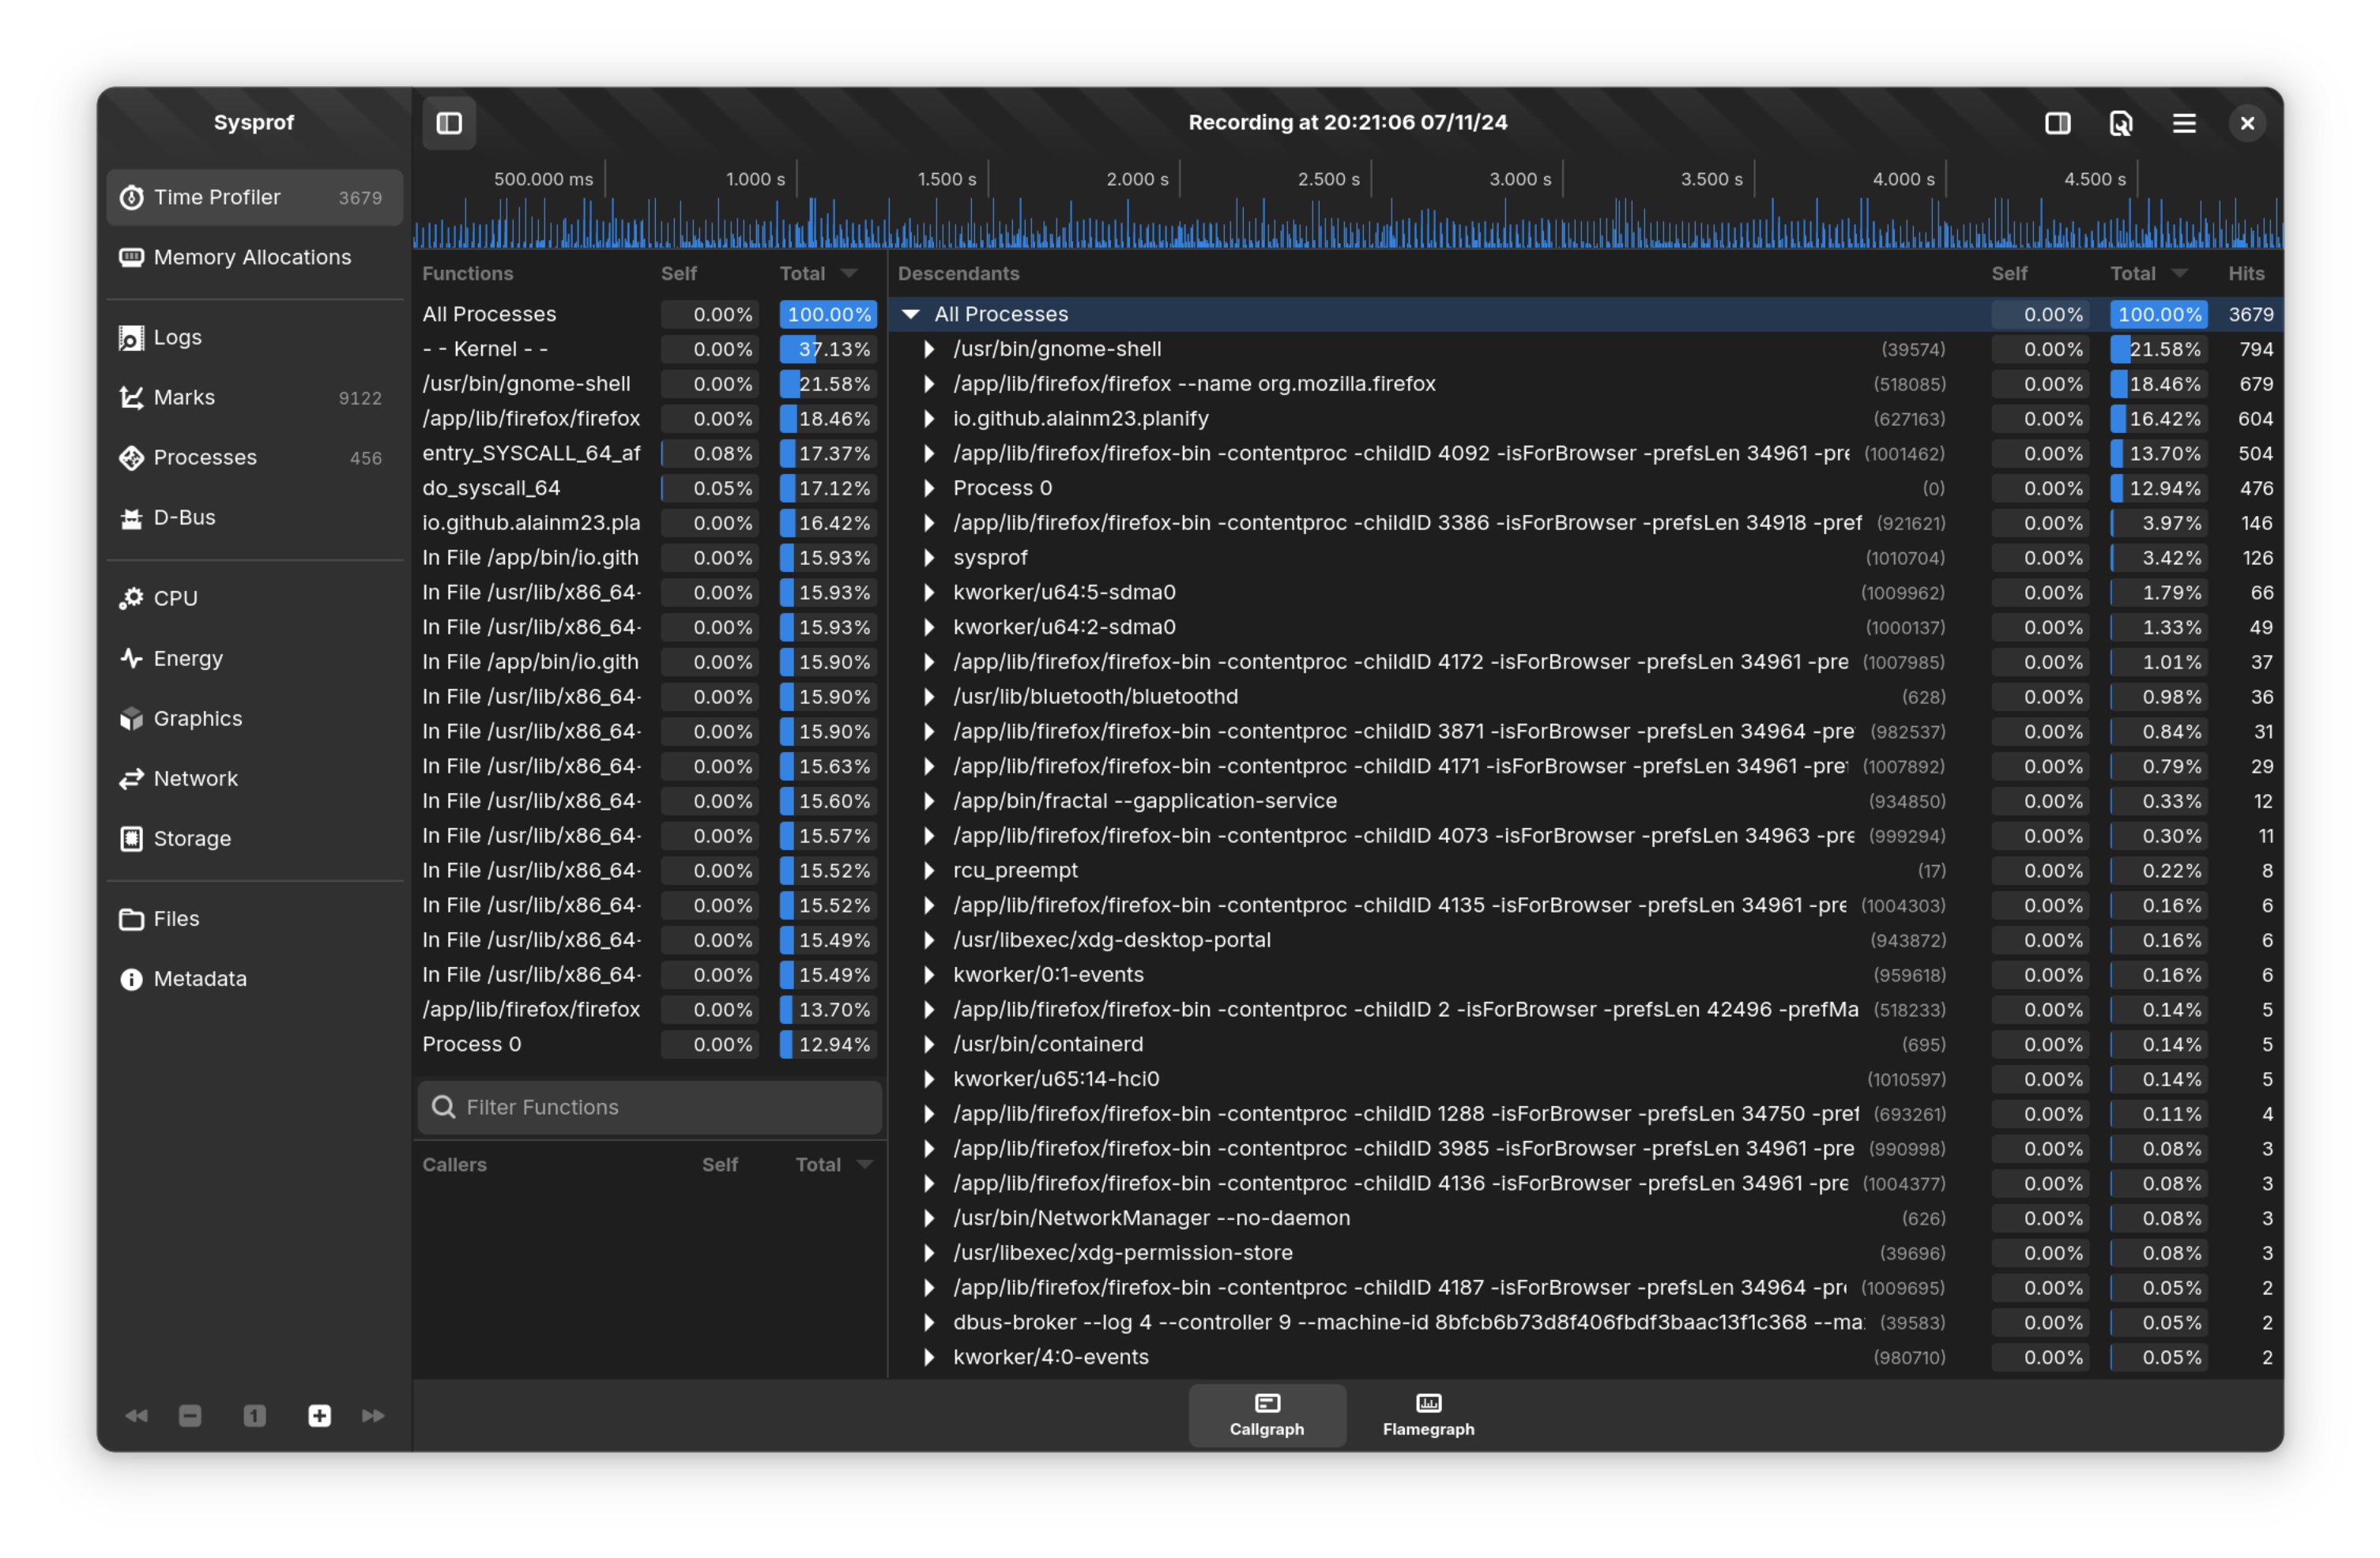 Callgraph
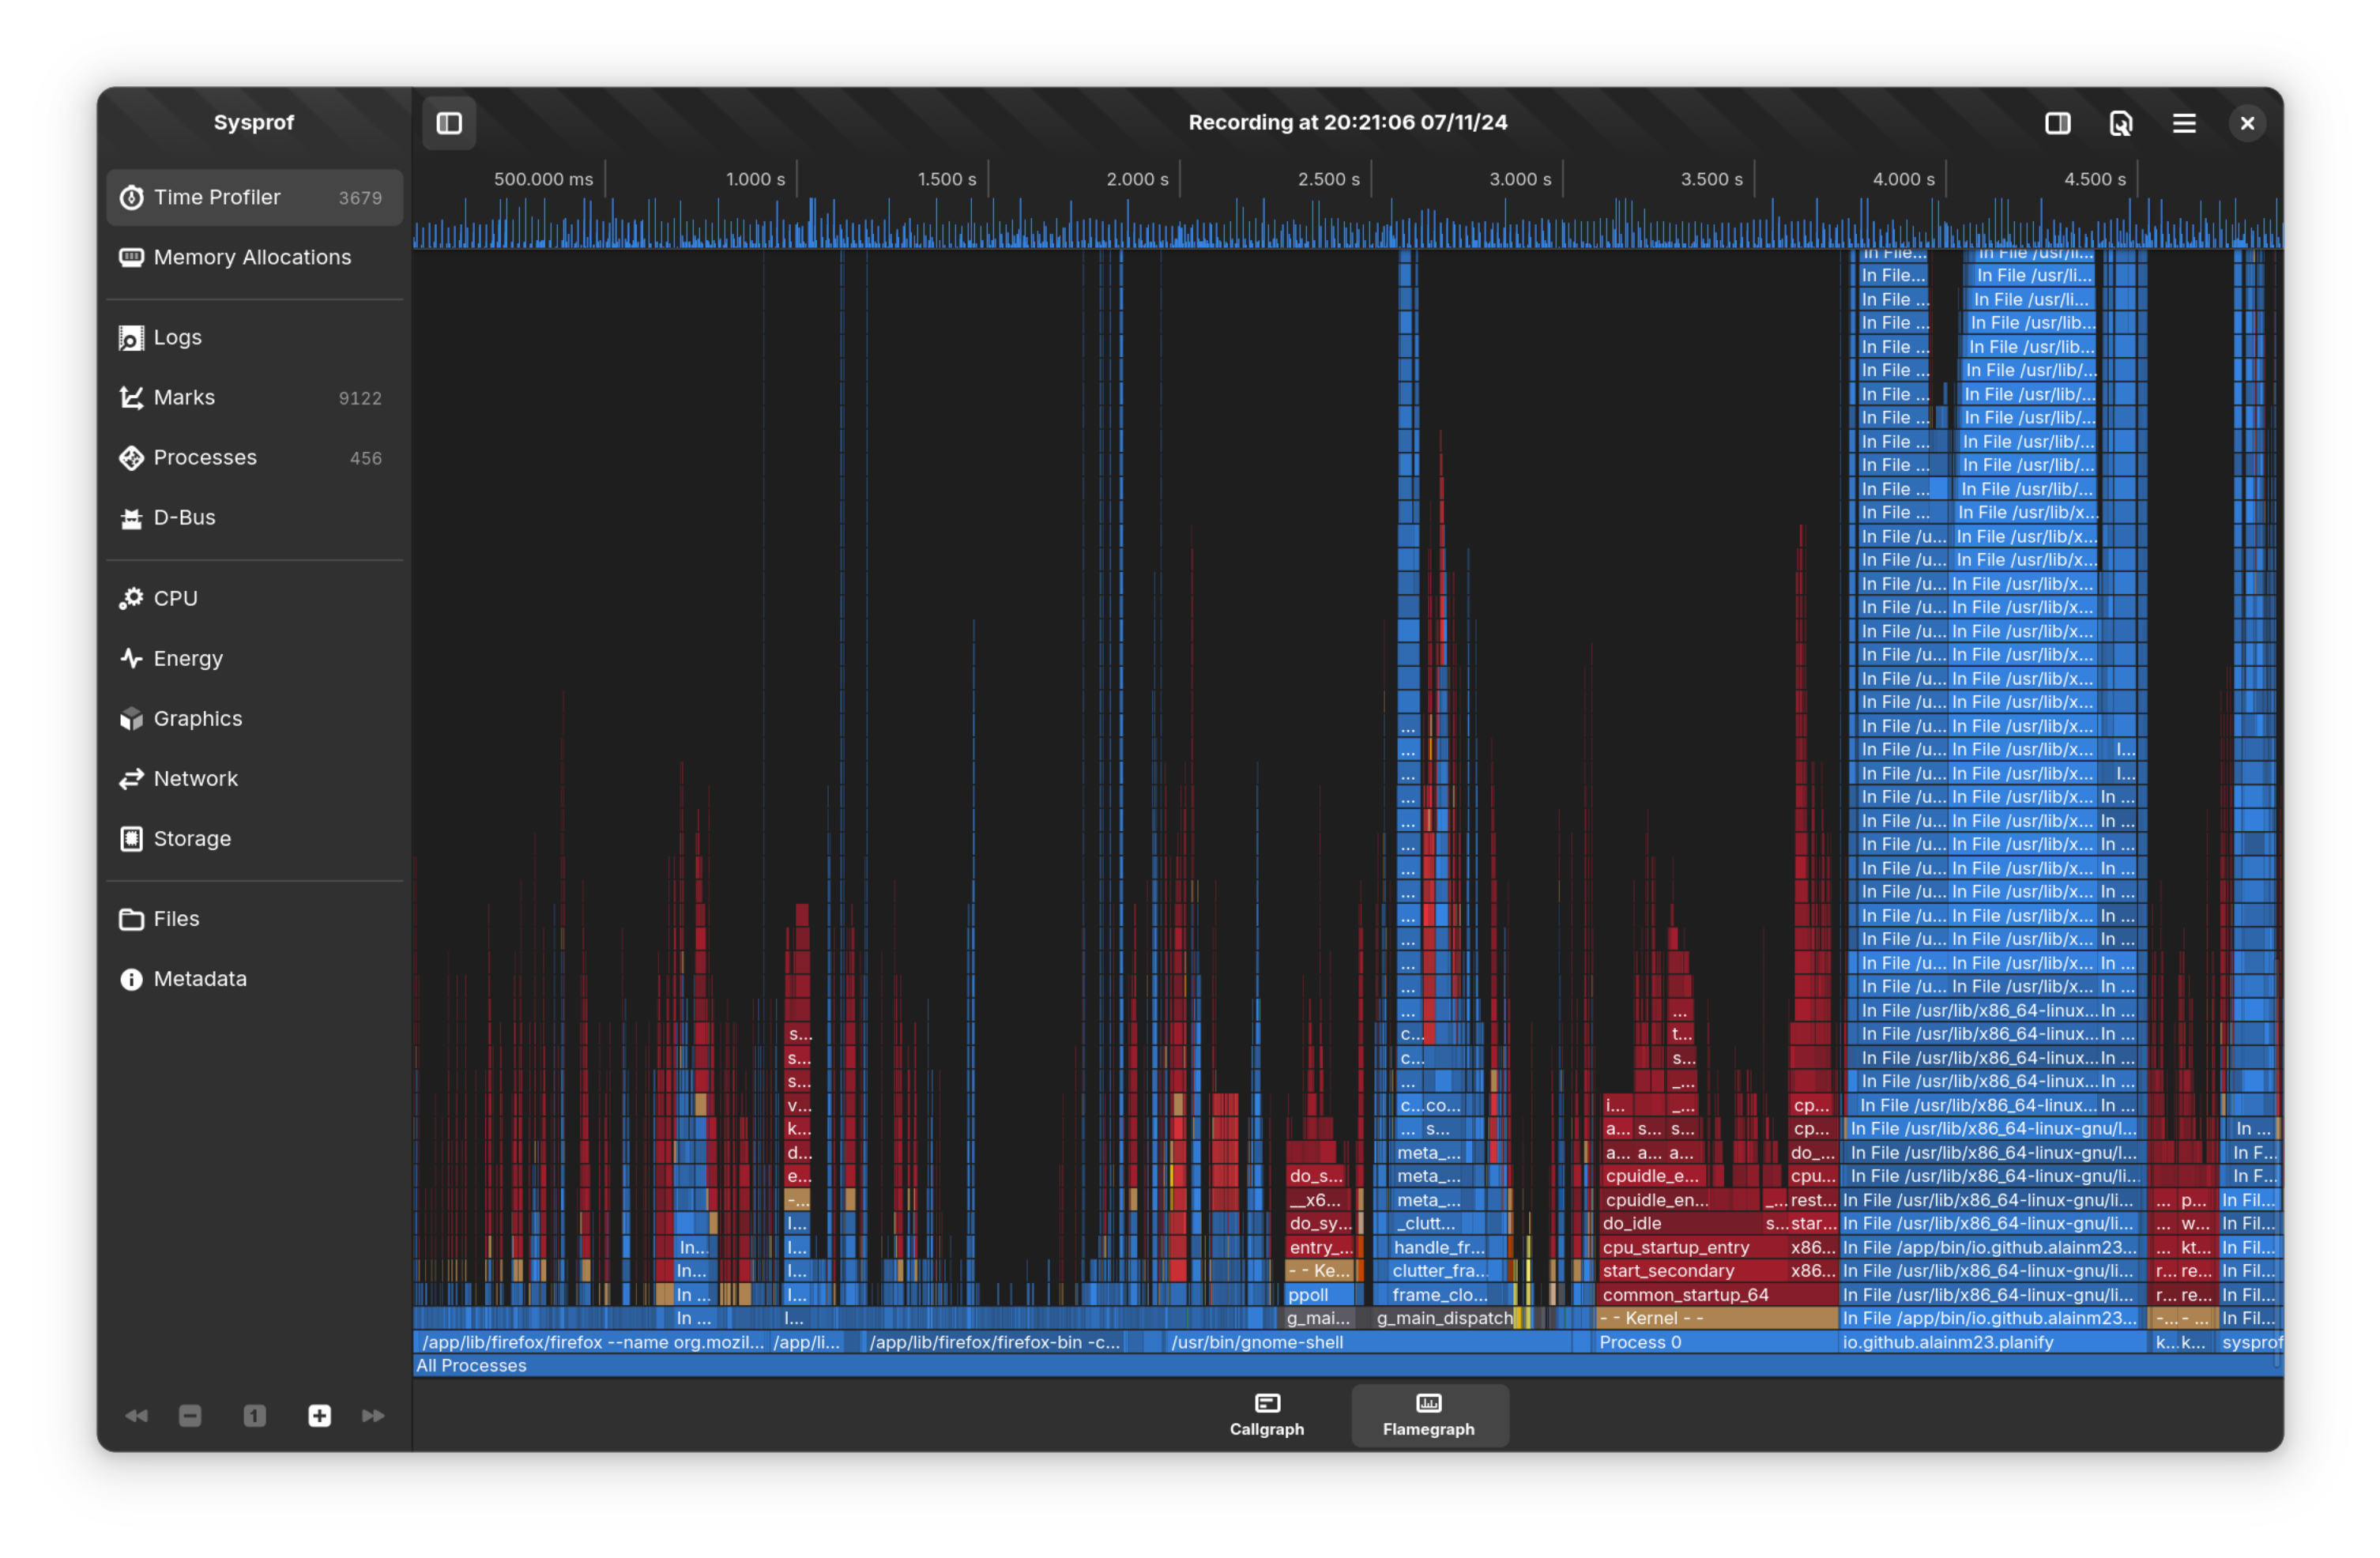 Flamegraphs
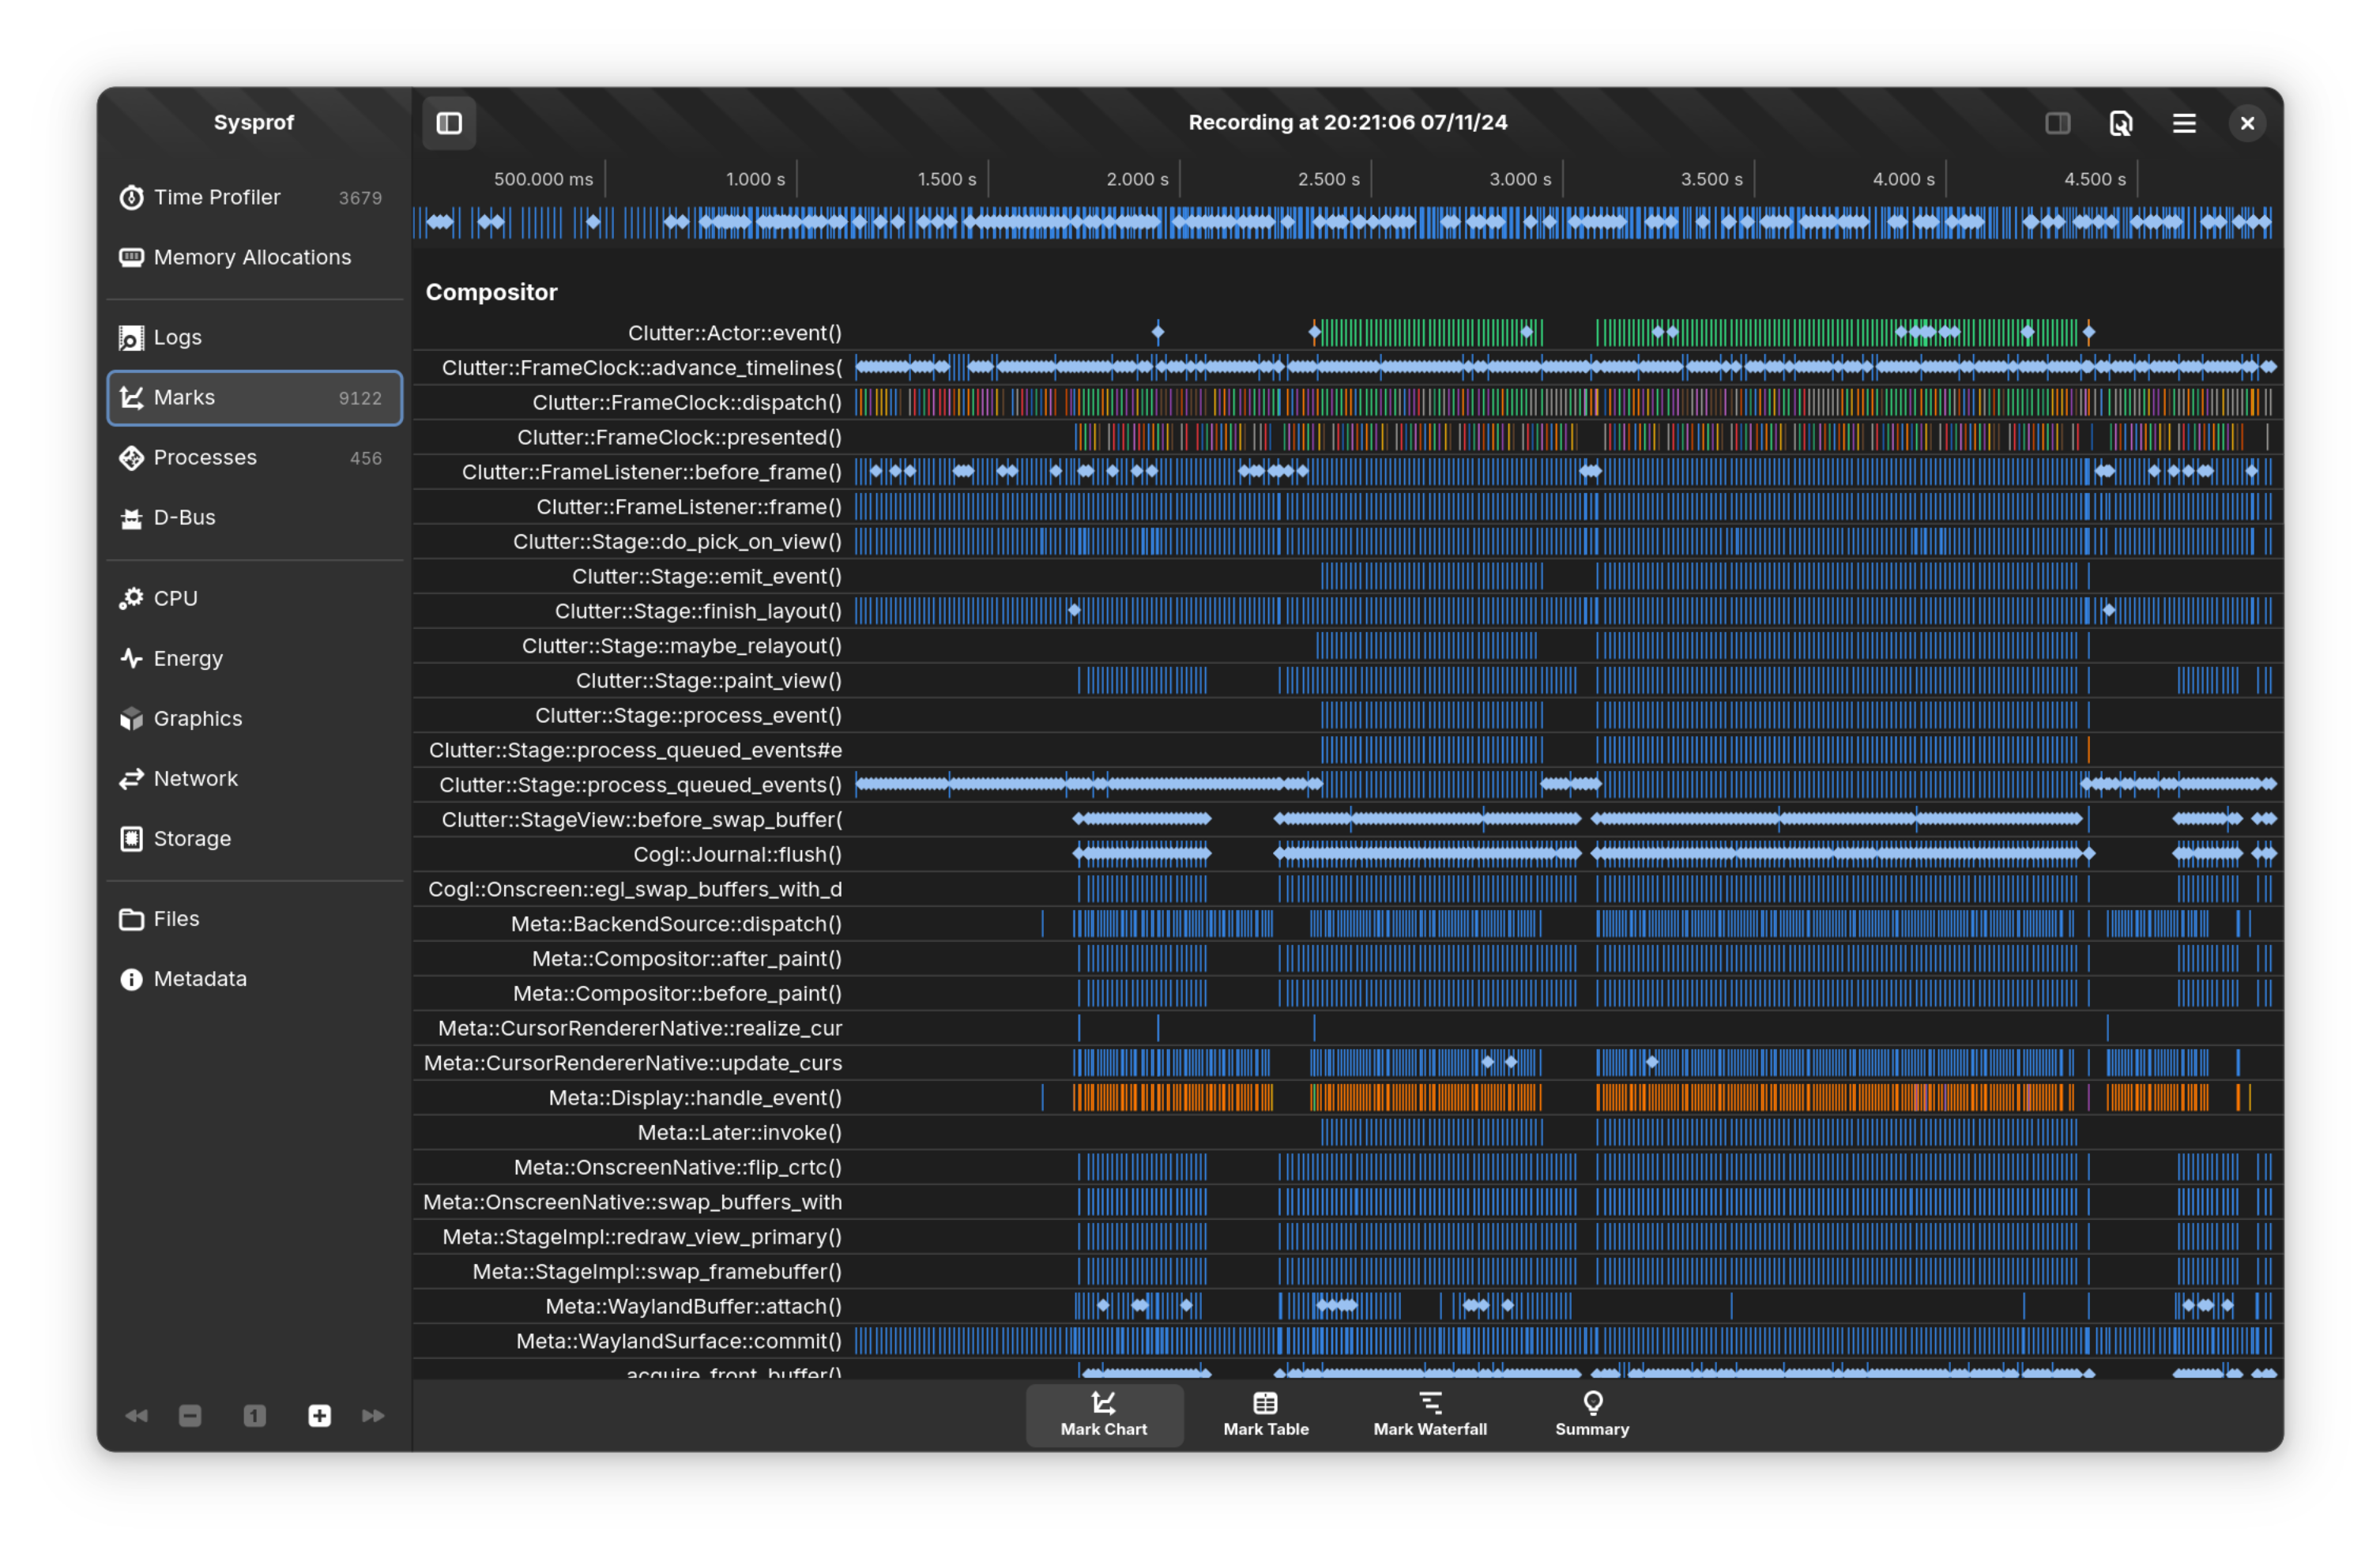 Mark chart
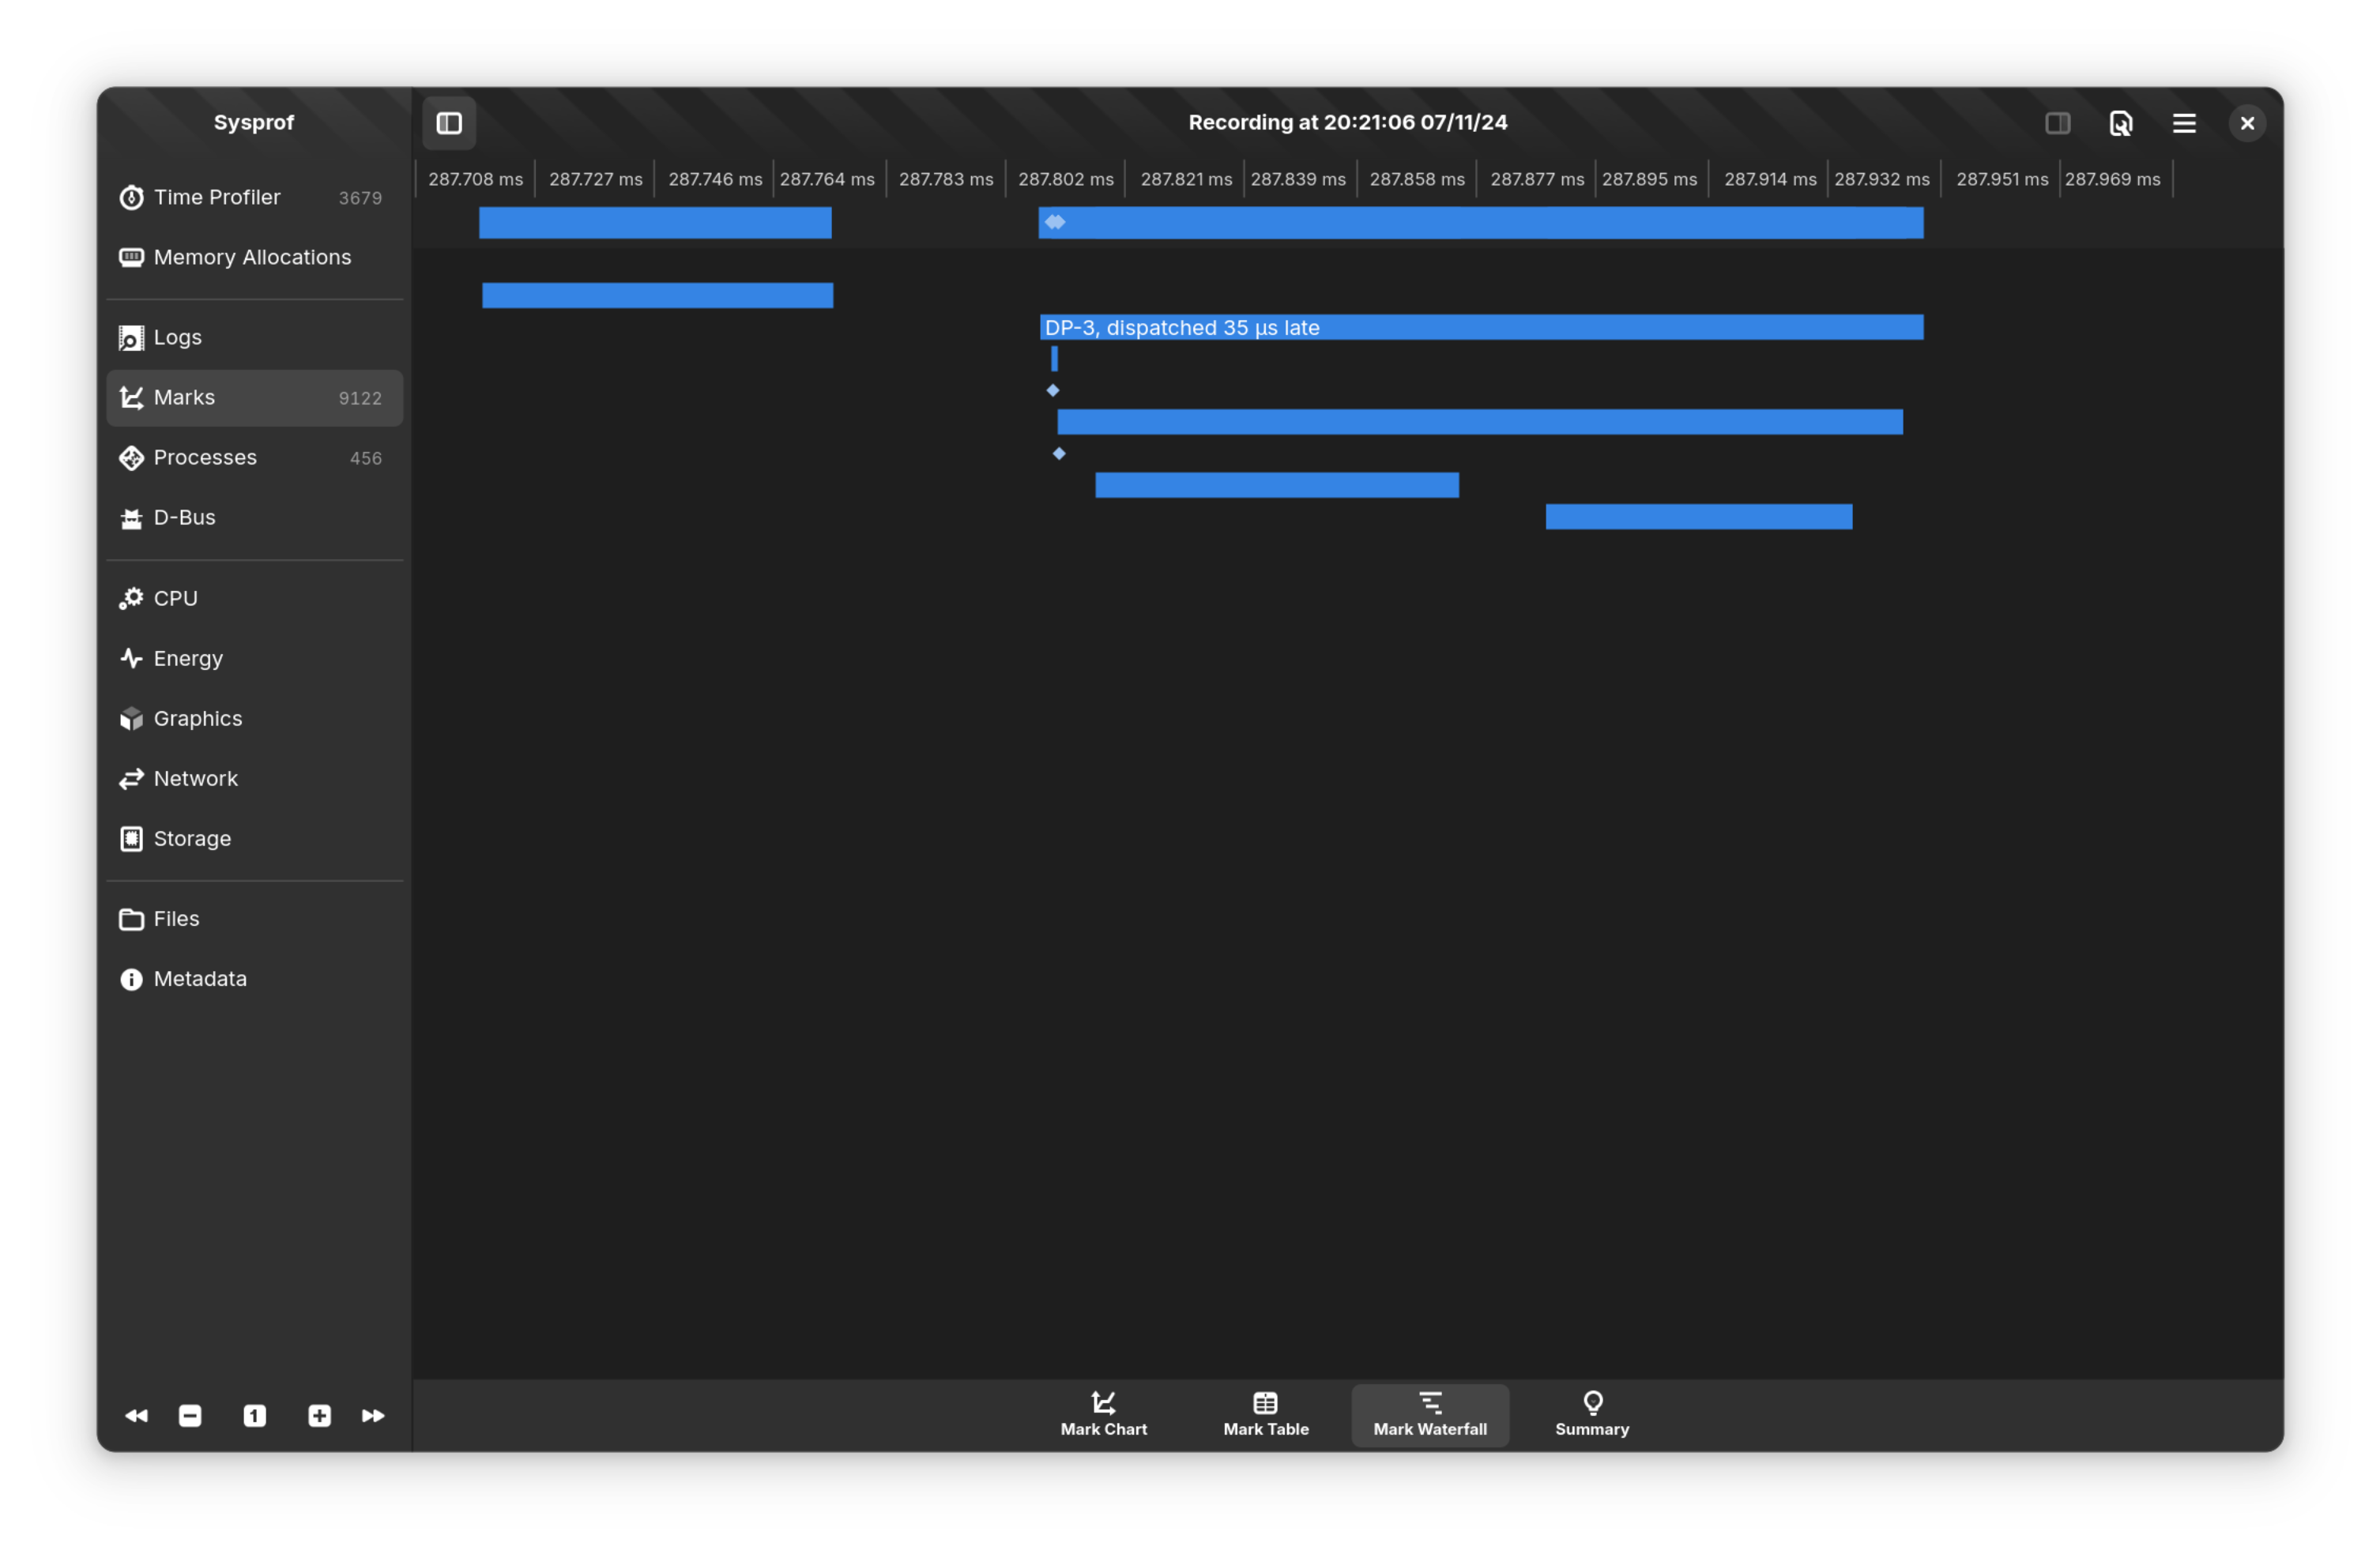 Mark waterfall
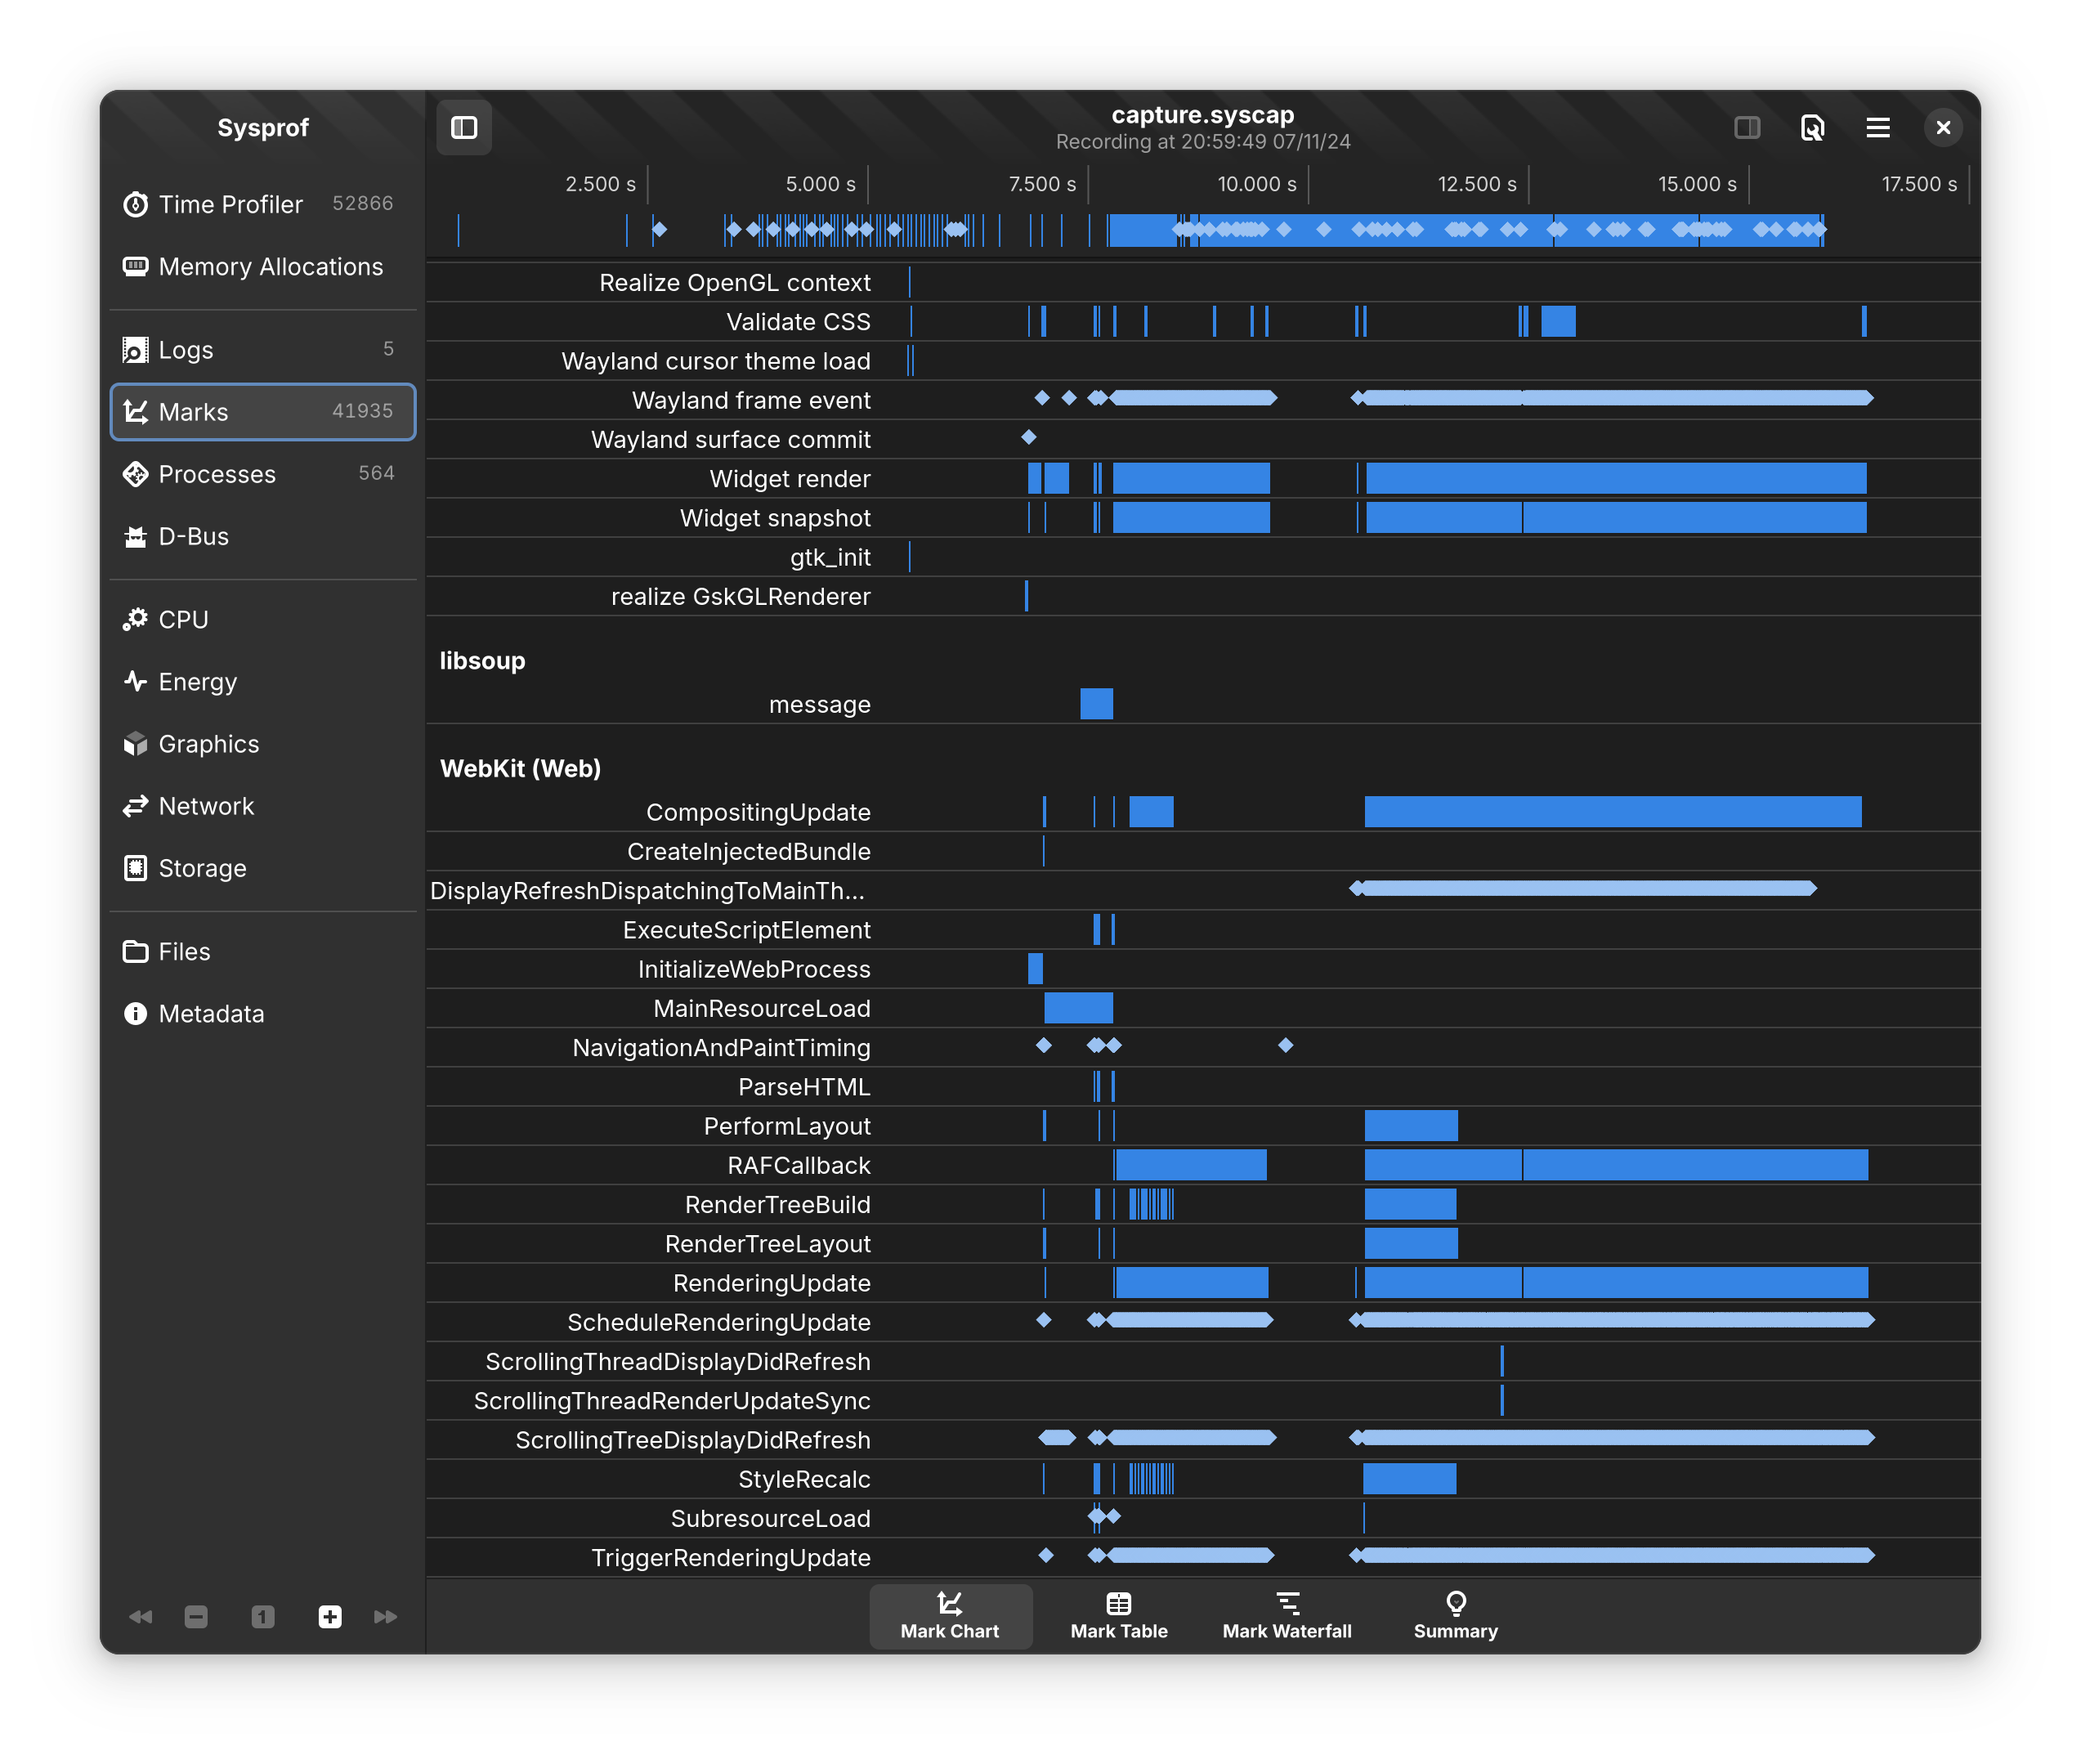

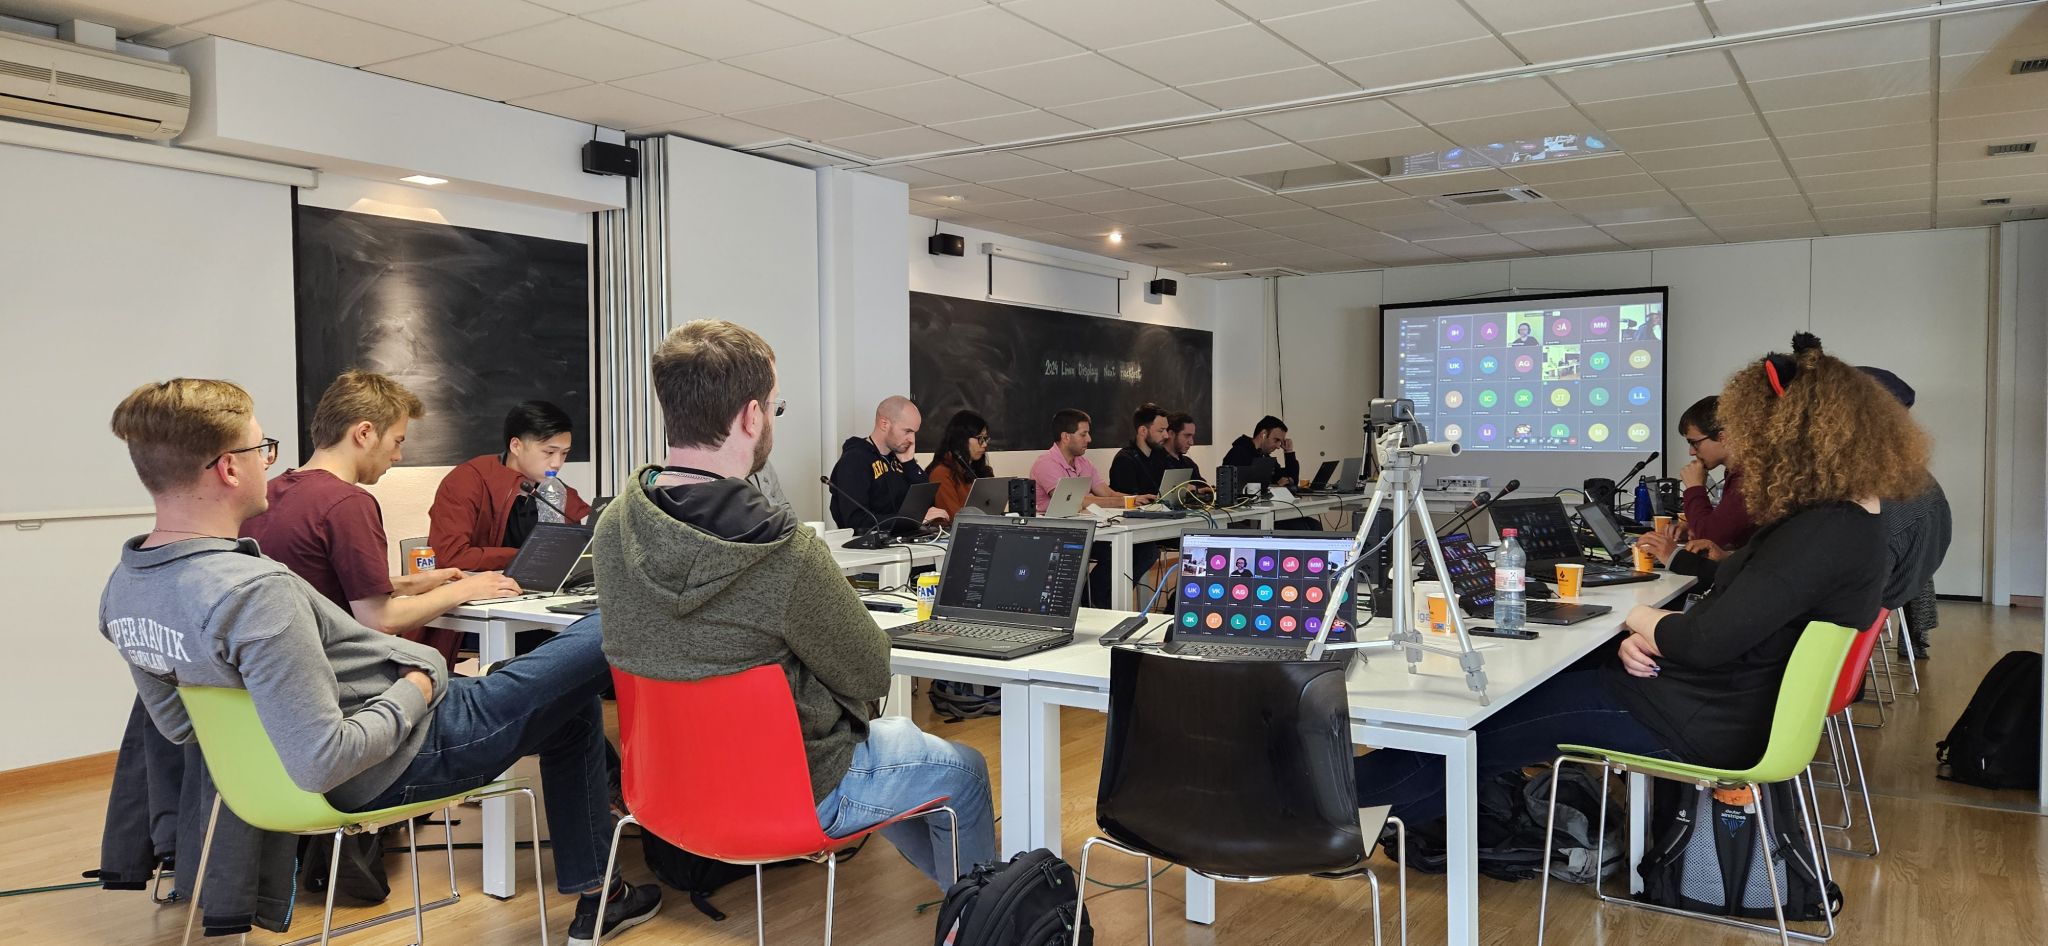
 First day of the
GStreamer Spring Hackfest 2024 -
First day of the
GStreamer Spring Hackfest 2024 -


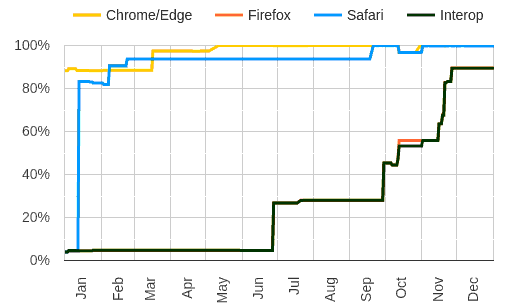
 [Caption] Test failures graph on major browsers
 [Caption] Interoperability among the major browsers 2023
 [Caption] Trybots in Gerrit
For example, the linux-rel trybot runs the web tests in the blink_web_tests step as below,
[Caption] Trybots in Gerrit
For example, the linux-rel trybot runs the web tests in the blink_web_tests step as below, [Caption] blink_web_tests in the linux-rel trybot
 [Caption] Sequence how to execute a test between run_web_test.py and content_shell