Conditional layer creation in the layer based SVG engine
Planet Igalia WebKit
July 14, 2026
July 13, 2026
Igalia WebKit Team
WebKit Igalia Periodical #70
Update on what happened in WebKit in the week from June 30 to July 13.
The summer continues with many updates to the new SVG engine (LBSE), improvements to the new Skia-based compositor, some small API additions, and ever-important stable releases with security fixes.
Cross-Port 🐱
Enabled the CloseWatcher
API and
dialog's closedby attribute in stable.
New API has been added which allows
specifying per-navigation User-Agent string values using
webkit_policy_decision_use_with_policies().
Applications now have more
granularity to decide which User-Agent websites are presented with,
complementing the existing global
WebKitSettings:user-agent
setting.
Graphics 🖼️
Roughly halved the cost of the Skia based compositor on WPE running on Vivante GPUs with the Etnaviv driver, by turning off Skia's mipmap sharpening option. That option is enabled by default and makes the Skia shader generator append a small negative level-of-detail (LOD) bias to every mipmap-capable texture sample. WPE does not use mipmapping at all, so the bias sharpened nothing, but it still turned each texture fetch into a LOD lookup, which is a slow path on the tiled GPUs found in the i.MX series. Disabling it restores usage of faster, plain fetch operations.
Fixed broken rendering with the Skia compositor on WPE when super-tiled textures are enabled on Vivante GPUs. Those tile buffers are allocated padded up to a multiple of 64 pixels, so the physical texture is larger than the logical tile, but the Skia backing failed to take this difference into account, leading to distorted tile images being rendered.
Stopped the Skia compositor from blending opaque layers on WPE. Every layer was drawn with the default source-over blend mode, which leaves GPU blending switched on even for fully opaque layers that do not need it, so the cost was paid on every composited frame.
Layers that are opaque, drawn at full opacity and using the default blend mode are now composited with a plain source blend mode instead, which lets Skia turn blending off and lowers GPU bandwidth usage, benefiting tiled GPUs the most.
Cached the concatenated SVG transform attribute
matrix on graphics elements in the
Layer-Based SVG Engine (LBSE).
Reading the transform attribute walked the whole transform list and
multiplied every item together again, and that happened around three times per
animation frame for each element, even though the result only changes when the
transform list itself is mutated.
The concatenated matrix is now stored on the element and invalidated whenever a transform-related attribute changes, so the multiplication runs once per mutation instead of once per read. This cuts repeated matrix work out of the per-frame path for animated SVG content.
Moved the clip out of the SVG child-paint loop in the Layer-Based SVG Engine (LBSE).
Painting a container used to set up a clip rectangle for every child shape in turn, so each shape did its own graphics-context save, clip and restore even though the clip rectangle was identical for all of them. When there is a single region to clip to and no child paints into its own layer, that clip is now established once and shared by every child, transformed or not.
This removes a per-shape save and clip from the hot painting path of SVG documents with many children.
Cached the SVG transform origin on SVG renderers in the Layer-Based SVG Engine (LBSE).
Every transform flush recomputed the origin for each non-layered SVG shape,
even though it only depends on the transform-origin style and the transform
reference box, and sampling MotionMark's Suits test at fixed complexity showed
that computation taking around 1% of the WebProcess main thread.
The origin is now cached and keyed on the reference box, with a style change
to transform-origin or transform-box dropping the cache, and the fast path
is limited to plain SVG transforms so viewport containers and CSS-transformed
renderers keep computing it directly. This removes a repeated per-shape cost
from animated SVG content, and the caching scope can be widened later.
Cached the SVG viewport size used to resolve the transform reference box in the Layer-Based SVG Engine (LBSE).
The default transform-box for SVG is view-box, so every transformed shape
resolved the viewport from the SVG root's content box again on each query,
both when updating its local transform and again during paint. The viewport is
constant after layout, so it is now cached on the <svg> element and only
recomputed when layout actually changes it, on resize, zoom or a viewBox
update. This removes another repeated per-frame computation from the transform
path for animated SVG content.
Coalesced the SVG transform flush into one minimal repaint per container in the Layer-Based SVG Engine (LBSE).
Once per rendering update WebKit processes every SVG renderer whose transform
changed, whether from script or an animation, and that repaint pass was the
dominant per-frame cost on MotionMark's Suits subtest. Instead of walking each
moved renderer up to its repaint container, the flush now computes each
child's rectangle in its parent's coordinate space, unions the children per
parent, maps that single union up the chain once, and issues one
repaintUsingContainer() call per repaint container rather than one per
shape.
This also stops requesting outline bounds, which for SVG merely duplicated the
visual overflow rectangle, and refreshes the bounding-box and visual-overflow
caches that a layout would normally update, so getBBox() and paint or
hit-test culling never read a stale rectangle. This collapses many
backing-store invalidations into one while keeping the repainted region
minimal, closing the performance gap to the legacy SVG engine.
Avoided re-resolving the SVG transform from style on every paint in the Layer-Based SVG Engine (LBSE).
Non-layer SVG renderers already cache their transform in m_localTransform,
but the painting code path used to recompute it from scratch each time,
concatenating the transform list, applying transform-origin and
multiplying matrices, only because the cached value uses a different transform
origin. The paint transform is now derived directly from the cached one by
translating around the nominal origin, which removes that per-paint
recomputation and cuts the cost of painting transformed SVG content.
Fixed a repaint bug in the
Layer-Based SVG Engine (LBSE) where dynamically changing a marker's
markerUnits or orient attribute left stale pixels behind. Such a change
resizes every shape that references the marker, but a referencing shape
without a layer gets no post-layout position update, so only its new bounds
were repainted—a shrinking marker left its former area on screen.
The visual overflow rectangle, markers included, is now cached at the end of shape layout while the geometry is still current, so a marker change can repaint the old bounds before recomputing the new ones. The extra repaint is limited to markers, since gradients and patterns do not affect a client's bounds, and the resulting repaint rects are more accurate than the legacy SVG engine's.
WPE WebKit 📟
Added a new feature flag,
BackForwardCacheWithMedia, which may be used to disable storing pages with
media content in the back-forward cache. This should solve the problem with
hardware decoders kept occupied on low-end devices in case of caching pages
with media after navigation.
Releases 📦️
WebKitGTK 2.52.5 and WPE WebKit 2.52.5 have been released, including a number of fixes for security issues, and therefore it is recommended to update. An accompanying security advisory will be published in the coming days. Additionally, these releases include small improvements and Web compatibility improvements.
That’s all for this week!
June 29, 2026
Igalia WebKit Team
WebKit Igalia Periodical #69
Update on what happened in WebKit in the week from June 22 to June 29.
After a small break after the Web Engines Hackgest, we're back with another round of updates, this time with a couple of exciting improvements to the SVG engine, a WebRTC fix, and support for WebP images with the toDataURL() API.
Cross-Port 🐱
Made RenderLayer creation conditional for SVG renderers in the new Layer-Based SVG Engine (LBSE), so a layer is now only created when one is actually needed for intrinsic reasons (3D transforms, opacity, etc.) instead of unconditionally for every renderer. Plain 2D transforms no longer force a layer and are applied directly during painting. This is the groundwork for follow-up patches that remove the intrinsic need for layers when applying clipping, masking and filters to SVG subtrees. It is an important milestone towards reducing the overhead that has been holding back LBSE performance compared to the legacy SVG engine.
Fixed the paint order of non-composited children around composited SVG siblings in the Layer-Based SVG Engine (LBSE). A layered container paints its children from a single flat list in DOM (and SVG paint) order, but some children are composited into their own GraphicsLayer for reasons like will-change, a 3D transform or certain opacity cases. The flat child list is now split into contiguous paint-order segments at those boundaries, with each run of plain children painted by its own overlay layer placed at the correct depth in the compositor's child list. This keeps every child in its DOM order without giving trailing siblings a RenderLayer or backing store of their own, and a container with no composited children produces no segments at all, so the common case costs nothing. This allows us to support composition within LBSE subtrees in a performant way, after dropping the requirement that every renderer creates a layer.
Multimedia 🎥
GStreamer-based multimedia support for WebKit, including (but not limited to) playback, capture, WebAudio, WebCodecs, and WebRTC.
Fixed initial decoding issues on LibWebRTC on platforms that do video decoding on the final playback stage (for efficiency and performance), instead of on the LibWebRTC decoder component.
Graphics 🖼️
Added support for producing WebP images with canvas' .toDataURL(). Using 1.0 as the quality setting will produce lossless images, which matches the behaviour of Chromium and Firefox.
That’s all for this week!
June 16, 2026
Igalia WebKit Team
WebKit Igalia Periodical #68
Update on what happened in WebKit in the week from June 9 to June 16.
The major highlight this week is the Web Engines Hackfest! Despite it, there are a variety of updates as well, such as various improvements to input handling in WPE WebKit and WebKitGTK, WPE menu rendering changes, and a plethora of other smaller improvements.
Cross-Port 🐱
Input methods may now know whether a field is intended to be used as search input, in which case the WebKitInputMethodContext:input-purpose property will have the value WEBKIT_INPUT_PURPOSE_SEARCH.
Due to GTK not providing an equivalent value for GtkInputPurpose, the default behaviour is to continue mapping search fields to GTK_INPUT_PURPOSE_FREE_FORM as before; but custom input methods may use the new value to detect search inputs. When using WPEPlatform, the value is mapped to WPE_INPUT_PURPOSE_SEARCH, which has been added as well.
Handle selections as part of moveBefore.
Corrected user activation propagation for close watchers.
Invalidate :lang() and :dir() selectors after moveBefore.
Enable Close Watchers in preview.
WPE WebKit 📟
WPE now renders its own popup menus for elements such as select. It supports all styling options the web provides such as colors and fonts. The internal menu can be overriden with the existing WebView::show-option-menu signal. Cog for example still renders its own (with a recent commit).
Community & Events 🤝
The Web Engines Hackfest started! We had a fantastic first day of talks, and now are heading to breakout sessions. Make sure to check the schedule for sessions that may interest you!
That’s all for this week!
June 08, 2026
Igalia WebKit Team
WebKit Igalia Periodical #67
Update on what happened in WebKit in the week from June 1 to June 8.
Another great week, this time we have a performance improvement implemented in the Skia-based compositor, an excellent writeup about how to investigate and isolate memory leaks in WPE WebKit, a couple of multimedia fixes, and a variety of improvements and fixes across WebKit ports.
Cross-Port 🐱
Implement dialog integration with close watcher.
Implement node iterator and live range pre-remove steps for in-progress moveBefore() implementation.
Fix an early return in CloseWatcher close to align with the spec.
The Web Inspector now shows DOM nodes associated with layout and rendering events in a separate column of layout timeline next to initiator, sizing, and timing information. Hovering over rows in the details table highlights the associated node, and clicking it reveals the node in the "Elements" tab. This makes it easier to match events with specific nodes and helps debugging changes to a web page.
Fix popover light dismiss to account for disabled command buttons.
Multimedia 🎥
GStreamer-based multimedia support for WebKit, including (but not limited to) playback, capture, WebAudio, WebCodecs, and WebRTC.
Fix mediaTime provided with requestVideoFrameCallback in case of captureCanvas as source.
Don't use the Rialto specific video decoder+sink on WebAudio, where its usage as a pure decoder isn't compatible and would cause issues.
Graphics 🖼️
Batched painting support was implemented in the Skia-based compositor, improving the performance in several cases.
Community & Events 🤝
Pawel Lampe published a blog post where he's presenting and discussing a guide on structured approach to narrowing down and debugging memory leaks within WPE WebKit.
That’s all for this week!
June 02, 2026
Igalia WebKit Team
WebKit Igalia Periodical #66
Update on what happened in WebKit in the week from May 19 to June 1.
The main feature of this week are new releases: stable ones with many security fixes, and development ones with the new Skia-based compositor enabled. Additionally, there was work on Web-facing features, optimizations, spell checking support for the WPE port, and more.
Cross-Port 🐱
WebKit now supports mirroring
MathML stretchy operators using the OpenType rtlm feature.
Replaced the CloseWatcherManager's
escapeKeyHandler, which will allow other types of close signals to be supported.
Implemented queuing mutation observer
records in the work-in-progress moveBefore() implementation.
Implemented popover integration with close watcher.
Fixed popover light dismiss to
account for popovertarget on input buttons.
Content filters now create temporary files in the compiled filters
directory, which ensures that a file
rename can always be used to place them at their final location. This avoids
falling back to a regular file copy, which can be slower, when the temporary
directory returned by g_get_tmp_dir() (typically /tmp) is in a different
volume than the filters' storage path configured for
WebKitUserContentFilterStore.
WPE WebKit 📟
Enabled spell checking support in
WPE. The existing implementation for
the WebKitGTK port, which uses the
Enchant library as a backend, was
generalized to provide spell checking support in WPE as well. The feature may
be toggled at build time using the ENABLE_SPELLCHECK CMake option.
Releases 📦️
WebKitGTK
2.52.4 and
WPE WebKit 2.52.4 have
been released; they include a number of fixes for security issues, and it is a
highly recommended update. The corresponding security advisory, WSA-2026-0003
(GTK,
WPE is available as well.
The release also includes a number of small improvements and Web compatibility
fixes.
Additionally, development releases WebKitGTK 2.53.3 and WPE WebKit 2.53.3 are available since last week. These include a change to use a new Skia-based compositor by default, which is intended to replace TextureMapper once ready. Therefore, bug reports related to website rendering are particularly welcome when using this and subsequent development releases.
Infrastructure 🏗️
The deprecated and un-maintained Flatpak-based SDK was removed. Developers working on the WPE and GTK WebKit ports are encouraged to migrate to the new SDK.
That’s all for this week!
Pawel Lampe
WPE memory leak investigation playbook
Depending on the web application, the WPE WebKit memory usage trend can vary. When simple web applications are being processed, the memory consumption tends to be virtually stable (the same) no matter the period. However, when more complicated web applications are being executed, the memory usage usually grows over time while going back to normal from time to time e.g., when GC / memory pressure mechanism releases all kinds of caches and not-needed memory. Therefore, memory growth itself is not unusual. Nevertheless, as the memory leaks happen in WPE at times, the memory growth is worth investigating — especially if very rapid or unbounded.
This article presents a structured playbook for investigating such a memory growth and memory leaks in WPE. Rather than diving straight into debugging tools, it starts from first principles: confirming the problem is real, choosing the right environment to work in, and narrowing down the leaking area before any heavy tooling is involved. The goal is to reach actual debugging as fast as possible, regardless of whether the environment is an embedded device or a desktop machine, and regardless of how quickly the problem reproduces.
Playbook #
The high-level list of recommended steps to follow is presented below. In a nutshell, the steps 1, 2, and 3 are meant to choose and follow the fastest possible investigation path so that actual debugging of the problem (step 4) can be started as soon as possible.
- Confirming the problem
- Identifying the best setup for reproducing the problem
- Narrowing down
- Debugging
1. Confirming the problem #
The ultimate first step when working with alleged memory leak is to check whether the observed memory growth is actually abnormal. In the case of web browsers in general, the memory growth alone may not necessarily mean something is leaking. There may be many regular reasons why the browser’s memory usage is growing, but the usual suspects are:
- JavaScript-level memory allocations — due to the very nature of JavaScript, the memory it allocates causes the overall web content process memory growth up until the garbage collector (GC) kicks in. Then (from the RSS perspective) some memory is usually freed. However, as it’s not easy to predict when the GC will be invoked (e.g., when the browser processes an application that performs heavy rendering), it’s possible that memory will grow but remain garbage-collectible.
- JavaScript Just-in-Time (JIT) compilation — when not explicitly disabled or limited, the processing of any web application that has JavaScript code associated with it will cause the browser to continuously compile the JavaScript code in the background so that it executes such code faster in runtime at the expense of memory that is required for storing compiled artifacts.
- Caches — as the WPE operates, it caches things such as web resources, style resolution artifacts, textures, glyph atlases, layer tiles, display lists, rasterization artifacts, and many others. Naturally, the cache sizes are limited, however, if many caches are growing at the same time, they may create an impression of a leak. The difference in that case is, the caches stop growing at some point.
Due to the above, to confirm the memory growth is abnormal, one should usually try the following first:
- Triggering memory pressure to force the browser to trigger GC and evict as many cache entries as possible,
- Rerunning the browser with JIT disabled to rule out the JIT-related memory growth — unless the application code is very small.
If the memory growth doesn’t stop with JIT disabled or its level does not go back to normal after triggering memory pressure, the growth can be assumed to be abnormal, and one can proceed to the next step.
2. Identifying the best setup for reproducing the problem #
When the memory growth is atypical, it needs to be narrowed down in a way that the final debugging is possible. For both narrowing down and the debugging, one should aim at the most flexible development environment along with the smallest possible web application that reproduces the problem quickly. What it means in practice is — desktop environment along with small demo web application that reproduces the problem. Whilst it’s not always possible to have such an environment, the 3 general rules are as follows:
- Desktop environment is usually better than embedded one in terms of working with memory leaks as it offers minimal overhead (e.g., in terms of compilation times) and huge flexibility in choosing the industry standard tools for profiling/debugging.
- Small web application is always better than a big one as long as it still reproduces the same problem in the same amount of time. In such case, a small application minimizes the amount of noise that usually stands in the way of profiling/debugging.
- A web application that reproduces the problem quickly is always better than the one that needs much more time for it. The worst thing that can happen in the case of narrowing down memory leaks, is when the memory growth is noticeable or starts after a very long time such as hours/days+.
Given the above, at this point one should go through the below steps:
- Check if the setup is trivial enough already — if the web application reproduces the problem quickly in a desktop environment and is simple enough, one should immediately jump to the Debugging section.
- Check if the problem can be reproduced on desktop assuming it originally reproduces on embedded.
- Check if the problem can be reproduced faster if it’s not reproducing fast enough.
- Check if the web application could be simplified.
Once the setup is simplified as much as possible, one should proceed to one of narrowing down sections depending on the setup. Also, if the setup is still not ideal, one should actively seek opportunities for simplifying the setup even during narrowing down as it’s likely that some new information will eventually open new possibilities in terms of simplifying setup.
3. Narrowing down #
When the problem has been confirmed but there are not enough clues to tell exactly which parts leak, the debugging cannot be started right away. In such case, it’s necessary to narrow down the problem to the browser/application area that can be easily debugged.
While in some cases narrowing down is not even necessary, quite often it takes orders of magnitude more time than actual debugging, and hence one should pay special attention to this step.
3a. Narrowing down on embedded when the problem takes a long time to reproduce #
This is the toughest situation one can find themselves in. When a problem takes a long time to reproduce (hours/days+), every iteration/test comes automatically with a significant cost. Moreover, when the environment is an embedded one, rebuilding WPE is usually more time-consuming and the amount of tooling is usually limited — or requires some work to bring it to the image at least.
Due to the above, narrowing down the problem in this setup requires a structured approach with extra care. In such case, the things to check should be approached in steps defined as follows:
- Things to check without rerunning the WebKit
- in case of embedded devices, extra care is needed when attaching a memory profiler. On low-end devices, memory profilers tend to slow down the application hard enough to trigger otherwise non-existent problems.
- Things to check without rebuilding the WebKit
- in case of embedded devices, one should prefer limiting JIT over disabling it as without it, the JS execution may be slow enough to trigger unexpected scenarios.
- Things to check if rebuilding WebKit
Ideally, while checking various things along the above steps, one should batch as many checks as possible within individual tests.
3b. Narrowing down on embedded when the problem reproduces quickly #
When the problem reproduces quickly, the limitations of embedded environment are not that relevant. In this scenario, one should prioritize getting debug symbols (RelWithDebInfo build) into the image and utilizing them by running
the browser with whatever profilers are available. For the specific things to check, one should seek inspiration in the following groups:
3c. Narrowing down on desktop when the problem takes a long time to reproduce #
This situation is similar to 3a and hence one should follow the things to check from the following groups:
- Things to check without rerunning the WebKit.
- Things to check without rebuilding the WebKit.
- Things to check if rebuilding WebKit.
However, this time, there are some extra opportunities around tooling:
- There should be many more tools available already in the system or available to be installed.
- Tools such as memory profilers that could slow down the application making it unusable on embedded, may turn out to be working well when the desktop-class processing power is available.
With the above in mind, it’s worth trying all the tools available with priority because if at least one tool works well, one can save hours of narrowing down.
3d. Narrowing down on desktop when the problem reproduces quickly #
This is technically the simplest possible scenario, so basically, all the possibilities are available. The most time-consuming activity in this case is very likely rebuilding WebKit itself — although it should still be relatively fast.
In such case, just after a few quick checks with the Web Inspector, it’s recommended to get debug symbols (RelWithDebInfo build) and start with tools such as memory profilers.
Other than the above, one should go through the following groups on things to check:
4. Debugging #
The WPE debugging is twofold and depends on whether the problem is within the engine (usually C/C++ code) or the web application (JavaScript code).
When problem lies in the engine #
Debugging WPE WebKit is the same as debugging any other C/C++ application on Linux (or Mac if the issue is cross-port and one prefers an Apple port to work with), and hence is outside the scope of this article. Some WebKit-specific information can be found in the WebKit Documentation article on building and debugging page and therefore is recommended as a first step.
When problem lies in web application #
When the problem lies in JavaScript code, the situation is usually fairly straightforward. The majority of bugs in this area should be reproducible across various browser engines and hence a full variety of tooling should be available. If the WebKit is preferred or if the problem reproduces only there, the tooling available is still very useful and helps debugging problems quickly. The ultimate tool in such case is the Web Inspector. On official WebKit’s web page there’s entire index of articles on Web Inspector. Among those, the most interesting read is about Timelines Tab where the most useful debugging can be done. Once the features of Timelines Tab are understood, the next important article is the memory debugging guide. It dives into the most important Timelines Tab subsections and showcases the work with heap snapshots which is a key. To supplement it, it’s very important to know the heap snapshot delta feature which is basically about button:
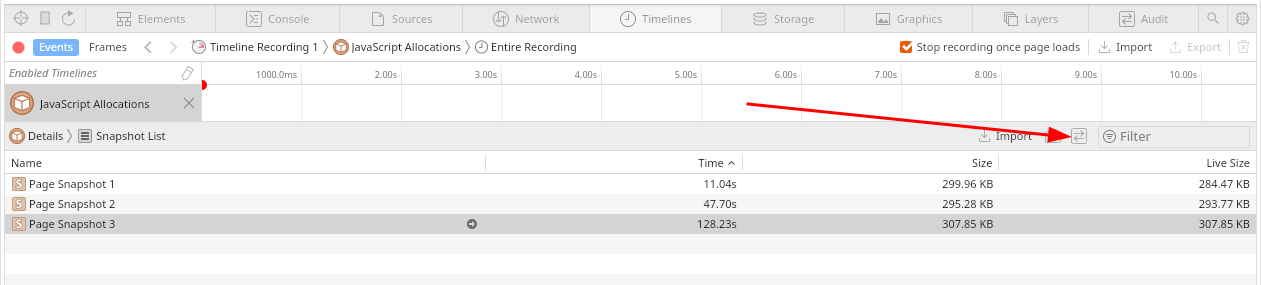
that allows one to inspect the delta-snapshot between 2 snapshots. It’s critical as it answers the question on what JS objects were added between the base snapshot and the later one. If some objects are piling up, it immediately shows which ones.
One important note on snapshots is that in some cases when using Web Inspector is not possible, one can generate the snapshots manually from the web engine’s C++ code by just calling GarbageCollectionController::singleton().dumpHeap(); at
some appropriate moment. In this case, the dump will be written to standard output. It can be then turned into a file and imported from any Web Inspector using Import button.
As the Timelines Tab with its subsections should be able to answer on what happens, to understand why it actually happens, the last missing piece is the JS debugger within Web Inspector. It’s not very different to debuggers in other engines, but it’s worth checking a dedicated article on it just to understand the capabilities.
Appendix #
Things to check without rerunning the webkit #
Even if the WPE is running with default settings in release mode, there are plenty of useful things that can be checked while the browser is still running:
- Identifying which WebKit process allocates abnormally,
- there are multiple ways to do this, but usually it’s as easy as using
psutility.
- there are multiple ways to do this, but usually it’s as easy as using
- Identifying how fast the process in question allocates the memory,
- this is useful to know at least for comparison purposes, but it may hint some problems already if the numbers correlate with what web application does.
- Checking logs from stdout, stderr, and journal (using
journalctl). - Checking detailed process memory statistics.
- Triggering and checking the impact of memory pressure on given processes RSS,
- in short, memory pressure triggers the cleanup of the majority of caches along with GC. Therefore, if this is able to bring memory back to normal level, then the problem is about caches, JS Heap / GC, or fragmentation.
- Attaching memory profilers if available,
- even if the debug symbols are not present, this may be useful to see what data is being captured and how the web application behaves when slowed down by profiler.
- Attaching other tools if available,
- even if the debug symbols are not present, various tools offer different perspectives on what the browser is doing. In some cases, such information may reveal some anomalies that may be related to the main issue.
- Cross-checking with other browsers,
- if other browsers show a similar pattern of memory usage, it’s very likely the problem lies in web application itself. Otherwise, it strongly suggests a bug in the WPE.
- Cross-checking with other ports,
- if any other WebKit port shows a similar pattern of memory usage, it allows one to narrow down the area in the code a bit based on what port it is:
- if the same behavior is visible in any of Apple ports, the problem is most likely related to cross-platform code,
- if the same behavior is visible only in GTK port, then the problem is most likely related to GLib-related part, coordinated graphics part, GStreamer-related part, or others that are shared.
- if any other WebKit port shows a similar pattern of memory usage, it allows one to narrow down the area in the code a bit based on what port it is:
Things to check without rebuilding the webkit #
- Tweaking and checking the logs from WPE,
- while generic logs may hint some unusual behavior, more specific ones such as GC logs (
JSC_logGC=1) may be used to check how the individual JS heap sizes evolve over time and how GC behaves. If it’s JavaScript leaking the memory, this log will quickly provide the evidence.
- while generic logs may hint some unusual behavior, more specific ones such as GC logs (
- Enabling Remote Web Inspector and checking:
- both breakdown and trend of memory usage in the memory timeline after doing a bit of recording,
- the effects of
takeHeapSnapshot()invoked from JS console:- as this function usually triggers GC internally, it may be used to check how much RSS memory is reclaimed by GC in isolation (followed up by scavenger),
- as this function takes a JS heap snapshot, it then can be used to explore manually if its contents point towards something interesting.
- Disabling JIT and checking the memory usage,
- if the memory usage is stable with JIT disabled, one should proceed to the step below.
- Limiting JIT and checking the memory usage,
- there are at least a few places (levels) where JIT compilation engine allocates memory. If limiting doesn’t resolve the issue completely, it’s likely the engine itself leaks some memory around temporary helper-heaps such as
AssemblerDataetc.
- there are at least a few places (levels) where JIT compilation engine allocates memory. If limiting doesn’t resolve the issue completely, it’s likely the engine itself leaks some memory around temporary helper-heaps such as
- Experimenting with environment variables and runtime preferences,
- some environment variables and runtime preferences change the behavior of the web engine significantly. If changing one of them makes the problem go away, it usually helps to narrow down the problematic area quickly.
- Running WPE with system malloc (environment variable
Malloc=1) and checking the memory usage,- when one suspects bmalloc/libpas issues with fragmentation or scavenger, it’s worth running a browser with system malloc to compare the memory evolution over time against the bmalloc/libpas.
- Limiting device memory and checking the memory usage,
- if triggering memory pressure is not possible, an alternative solution is to limit the device memory so that the browser is under constant memory pressure.
- Running WPE with sysprof and checking:
- stack traces — to see what parts of engine are particularly active as it may hint some problematic area,
- WebKit marks — to see what the engine is doing as well as quantitative data in marks such as
EventLoopRunetc. as in those cases the numeric value trends may reveal resource pile up.
Things to check if rebuilding webkit #
- Building WPE in release mode with debug symbols and re-trying memory profilers or other tools if the debug symbols were not present before,
- if some desired tools such as heaptrack, valgrind, perf, or strace were not available before, it’s the right moment to get/build them as well,
- once the debug symbols are in, one should try:
- attaching memory profilers if available, and inspecting detailed memory allocation reports,
- attaching other tools if available, and investigating the traces.
- Building and running with Google perftools,
- as WPE allows switching to system malloc as an allocator, it’s possible to use custom malloc implementation with instrumentation such as gperftools. For that, the recommended read is this article from fellow Igalian, Pablo Saavedra.
- Building and running with sanitizers,
- if the problem is about low-level leak, address/leak sanitizer should be able to help pointing out the problematic area.
- Building and running with memory sampler,
- the data produced by memory sampler is roughly the same as inspector’s memory timeline, however, it’s much more convenient as it doesn’t need web inspector at all.
- Building and running with node statistics,
- when memory growth seems to be related to DOM mutations, it’s worth enabling and reporting node statistics periodically — in some cases, it may directly suggest what the problem is about.
- Building and running with malloc heap breakdown,
- when all other means fail, a very good last-resort approach for investigating memory usage statistics via a debug-only WebKit feature called Malloc Heap Breakdown. The details can be found in the dedicated article about it.
- Building and running with libpas statistics,
- On very rare occasions such as memory fragmentation or allocation issues, it may be worth checking the libpas (low-level memory allocation and management library) statistics as WPE uses it by default on the vast majority of platforms.
Individual instructions #
Checking detailed process memory statistics #
As WPE WebKit uses multi-process architecture, there are multiple processes that can be checked, although the most interesting one is usually the Web Content Process. Once the PID of the given process is determined (e.g., using ps utility)
the usual steps to check detailed memory statistics are:
cat /proc/<PID>/statusorcat /proc/<PID>/statmfor very basic statistics,pmap -X <PID>- for detailed statistics (if available),cat /proc/<PID>/smaps_rollupandcat /proc/<PID>/smapsfor detailed statistics (requiresCONFIG_PROC_PAGE_MONITORkernel configuration option).
Triggering memory pressure from OS #
WPE uses a so-called Memory Pressure Monitor to observe the memory usage in the system and to react if there’s not much memory left. The default thresholds are specified in MemoryPressureMonitor.cpp and usually are
90% for non-critical and 95% for critical response. Depending on the response, WPE schedules GC and clears internal caches immediately.
As the above is usually on by default, one can leverage it to trigger GC (along with cache cleanups) by filling up the available memory in the OS to 95+%. There are many ways to allocate memory, yet the simplest is using stress:
- e.g.
stress --vm 1 --vm-bytes 1024M --vm-keepto allocate 1024 MB.
Attaching memory profilers #
When attaching any memory profiler, unless one wants to profile only native allocations (Skia, GStreamer, ICU, etc.), the key is to use Malloc=1 environment variable on WPE startup so that bmalloc uses system malloc instead of libpas.
Also, if WebKit is using a sanboxed mode in given configuration, it’s usually necessary to use WEBKIT_DISABLE_SANDBOX_THIS_IS_DANGEROUS=1 as well. Then the commands are as follows:
- to attach heaptrack:
heaptrack -p <PID>so e.g.heaptrack -p $(pgrep WPEWebProcess)(see this article for details),
- to run with valgrind’s massif (as attaching to running process is not possible):
valgrind --tool=massif --trace-children=yes <WPE-BROWSER-COMMAND>(see this article for details).
Attaching other tools #
If memory profilers are unusable or unavailable, it’s worth checking if other tools are present and experimenting a bit with them if so. In some cases, tools other than memory profilers may give some hints on further investigation or reveal a suspicious pattern within application execution. Some ideas for experiments with various tools are listed below:
- strace:
strace -c -p $(pgrep WPEWebProcess)— strace called with-cgives a nice summary of system calls executed by the traced application. It can be useful to check the overall syscall usage pattern to see if there are any anomalies.strace -p $(pgrep WPEWebProcess) -e trace=mmap,munmap,mremap,madvise -tt— strace focused onmmap()-related system calls may be useful to debug libpas.
- perf:
perf record -F 999 -ag -p $(pgrep WPEWebProcess) -- sleep 60— regular recording with perf can be very useful, especially if symbols are available. With that, one can generate flamegraphs and investigate what’s going on in the browser. While it’s not about profiling memory, it may be helpful to narrow down at least a bit.perf record -F 999 -e syscalls:sys_enter_mmap,syscalls:sys_enter_munmap,syscalls:sys_enter_mremap:sys_enter_madvise -ag -p $(pgrep WPEWebProcess) -- sleep 60— perf focused onmmap()-related system calls is much more superior than e.g. strace as it also records stack traces. Therefore, if debug symbols are present, and if the memory growth is very rapid, it’s very likely the libpasmmap()stacktraces will lead to the growth origin statistically.perf trace -e mmap,munmap,mremap,madvise -p $(pgrep WPEWebProcess)— this is very much similar to strace focused onmmap()-related system calls as it shows a live preview of what’s happening.
- sysprof:
sysprof-cli -f— while running system-wide sysprof won’t make WPE push marks into it, the profiling trace may still be useful to some degree, especially if debug symbols are available.
Disabling JIT #
This can be done using an environment variable:
JSC_useJIT=false.
Limiting JIT #
Limiting JIT can be achieved via environment variables:
JSC_jitMemoryReservationSize=<BYTES>to limit JIT memory usage (the limit is semi-strict as some JIT compilation engine buffers are limited by this value indirectly),JSC_useFTLJIT=falseto disable FTL tier,JSC_useDFGJIT=falseto disable DFG and FTL tiers,JSC_useBaselineJIT=falseto disable Baseline, DFG, and FTL tiers.
Tweaking WPE logs #
WPE is a fairly complex piece of software and hence it offers various logging capabilities related to WebKit itself, as well as to related libraries. The vast majority of logging can be controlled via environment variables:
WEBKIT_DEBUG=allto enable all logging channels,WEBKIT_DEBUG=Layout,Media=debug,Events=debugto enable selected logging channels,JSC_logGC=2to enable JS garbage collector logs,GST_DEBUG=4to enable gstreamer (multimedia-related) logs (see the documentation),G_MESSAGES_DEBUG=allto enable GLib-level logs.
If MiniBrowser (or similar browser) is used, one can also set a runtime preference to enable JS console.log(...) logging to the standard output:
--features=+LogsPageMessagesToSystemConsole.
Enabling remote web inspector #
Enabling WPE’s remote web inspector is a twofold process:
- The first step is to run WPE with the proper environment variable so that it starts listening on
IP:PORTusing tcp socket:
WEBKIT_INSPECTOR_SERVER=IP:PORTis the most reasonable option as it usesinspector://protocol that can be utilized by WebKit-native browsers such as GNOME Web (Epiphany) or Safari,WEBKIT_INSPECTOR_HTTP_SERVER=IP:PORTis a less preferable alternative that uses HTTP protocol and technically works from any browser. However, no seamless integration is guaranteed in this case.
- The second step is to connect from a regular web browser to the WPE:
- using
inspector://IP:PORT/if native inspector server was started, - using
http://IP:PORT/if HTTP inspector server was started, - forwarding the ports using
socat tcp-l:PORT,fork,reuseaddr tcp:IP:PORTif the WPE is running in unreachable network.
Experimenting with environment variables and runtime preferences #
The most outstanding environment variables changing the behavior of WPE are the following:
WPE_DISPLAY— assuming the new WPE platform API is used, this environment variable allows one to switch the pre-defined platform implementation thus changing a platform-facing part of graphics pipeline. The valid options are:WPE_DISPLAY=wpe-display-headless— for headless implementation,WPE_DISPLAY=wpe-display-drm— for direct rendering manager integration,WPE_DISPLAY=wpe-display-wayland— for wayland integration,
WEBKIT_SKIA_ENABLE_CPU_RENDERING— when set to1, rendering the DOM contents to the layers is done using Skia CPU backend instead of GPU one.
The most outstanding runtime preferences changing the behavior of WPE are the following:
CanvasUsesAcceleratedDrawing— when disabled, 2D canvas will use Skia CPU backend instead of GPU one,LayerBasedSVGEngine— when enabled, WPE uses a different SVG engine internally,AcceleratedCompositing— when disabled, WPE uses experimental, non-composited mode that bypasses all of the compositor work.
Limiting device memory #
On the majority of embedded devices, the device memory can be limited by:
- Interrupting the boot sequence (usually holding some key such as
zupon booting), - Invoking the command to change the limit and booting, e.g.:
> global linux.bootargs.console="console=ttymxc0,115200n8 mem=2G"
> boot
Running WPE with sysprof #
Regardless of whether it’s done on desktop (using wkdev-sdk) or on embedded device, the command is always as simple as:
sysprof-cli -f -- <WPE-INVOCATION>.
See the documentation entry for more details.
Building WPE in release mode with debug symbols #
On desktop, the simplest way to get release with debug symbols is to utilize CMake’s build type by using -DCMAKE_BUILD_TYPE=RelWithDebInfo within WPE build command, so:
./Tools/Scripts/build-webkit --wpe --release --cmakeargs="-DCMAKE_BUILD_TYPE=RelWithDebInfo".
On embedded, when Yocto is used, one should tweak settings such as:
IMAGE_GEN_DEBUGFS = "1"
IMAGE_FSTYPES_DEBUGFS = "tar.bz2"
DEBUG_BUILD = "1"
EXTRA_IMAGE_FEATURES_append = " dbg-pkgs"
and potentially INHIBIT_PACKAGE_STRIP to control whether debug symbols should be kept with the binary or not. This may be necessary occasionally as some tools have problems reading .gnu_debuglink and therefore work only
with symbols included in the binaries.
Building and running with sanitizers #
WebKit works pretty well with all kinds of sanitizers. To build with any of them a CMake-level helper called ENABLE_SANITIZERS can be used by specifying -DENABLE_SANITIZERS=address, -DENABLE_SANITIZERS=leak etc. With that, the command for
building e.g. on desktop could look like:
./Tools/Scripts/build-webkit --wpe --debug --cmakeargs=-DENABLE_SANITIZERS=address.
For more details, one can refer to this article from fellow Igalian, Fujii.
Building and running with memory sampler #
When WPE is built with -DENABLE_MEMORY_SAMPLER=ON, the simple memory sampler can be started along with the browser using environment variable:
WEBKIT_SAMPLE_MEMORY=1(accompanied byWEBKIT_DISABLE_SANDBOX_THIS_IS_DANGEROUS=1if needed).
With that, the memory of various WPE processes is sampled every second, and saved to the files under /tmp directory continuously.
Building and running with node statistics #
Node statistics are a debug-only feature that can be enabled by:
- changing
0of#define DUMP_NODE_STATISTICS 0to1inSource/WebCore/dom/Element.h, - adding
dumpStatistics()call, to e.g.Nodeconstructor inSource/WebCore/dom/Node.cpp.
Building and running with libpas statistics #
Libpas statistics are a debug-only feature that can be enabled by changing 0 of #define PAS_ENABLE_STATS 0 to 1 in Source/bmalloc/libpas/src/libpas/pas_config.h and then running WPE with environment variable PAS_STATS_ENABLE=1.
May 18, 2026
Igalia WebKit Team
WebKit Igalia Periodical #65
Update on what happened in WebKit in the week from May 11 to May 18.
For this week we have quite a collection of news! Ranging a variety of improvements to dialog.requestClose(), rendering fixes, the new Skia-based compositor enabled by default, and proper versioning and improvements to the WebKit Container SDK, there's news for everyone.
Cross-Port 🐱
Update the closeWatcher.requestClose() function to no longer require user activation, aligning with the spec.
Implement actually moving the node in the DOM when moveBefore() is called.
Fix handling of nested calls to dialog.requestClose().
Add missing preliminary checks to dialog.requestClose().
Graphics 🖼️
Fixed an issue where background images were unexpectedly stretched, primarily affecting the reCAPTCHA checkmark image.
The new compositor using Skia API instead of TextureMapper is now enabled by default.
Infrastructure 🏗️
Added opt-in auto-enter for the WebKit Container SDK - the GTK/WPE wrapper scripts (build-webkit, run-webkit-tests, run-api-tests, etc.) now relaunch themselves inside a pinned wkdev-build podman container when WEBKIT_CONTAINER_SDK_ENABLE_AUTOENTER=1 is set. A new .wkdev-sdk-version file at the repo root pins the SDK image, so the image can be bumped in a PR and validated through EWS. Without the flag, wrappers run on the host exactly as before.
Introduced a proper version scheme for the wkdev-sdk image provided by the WebKit Container SDK so consumers can pin to a known revision. The :latest tag, the WKDEV_SDK_TAG/--tag override and the tag/* branch mechanism are replaced by a single machine-checkable format <major>.<minor>-v<count>-<gitsha> (e.g. 2.53-v1-916f9ef), where <major>.<minor> tracks the WebKitGTK/WPE release cycle, v<count> is the per-cycle SDK build counter, and <gitsha> traces the image back to its source commit. wkdev-create gains a --version switch (full or bare <major>.<minor>). wkdev-update supports updating from latest tag to the new versioning scheme, just run it on your host to update to the latest SDK.
Switched the wkdev-build container from a persistent container to ephemeral podman run --rm --init per invocation. This removes the manual podman rm step necessary whenever container creation arguments changed (which the tooling was not handling by itself), the first-run recursive-chown cost, and the podman start step after host reboots.
That’s all for this week!
May 11, 2026
Igalia WebKit Team
WebKit Igalia Periodical #64
Update on what happened in WebKit in the week from May 4 to May 11.
This week we have a bag of exciting updates, such as fixes to crashes, better YouTube playback, a handful of advancements to WebXR, and the development releases of WebKitGTK and WPE WebKit 2.53.2.
Cross-Port 🐱
If the filesystem runs out of space while the NetworkProcess is writing into its network cache, the process will crash with SIGBUS. This would surface to users as the "Internal error fired from WebLoaderStrategy.cpp(559) : internallyFailedLoadTimerFired" error, and would be handled by re-spawning another NetworkProcess that would similarly fail.
This was addressed by using fallocate, if available, to reserve the required size. If fallocate fails to reserve, the NetworkProcess will skip caching, avoiding the crash. If fallocate is not available, the existing behaviour is preserved.
Networking 📶
Networking support, including the libsoup HTTP library.
libsoup now supports the zstd compression encoding.
Multimedia 🎥
GStreamer-based multimedia support for WebKit, including (but not limited to) playback, capture, WebAudio, WebCodecs, and WebRTC.
getUserMedia() and getDisplayMedia() support should work better thanks to a couple PipeWire related fixes.
Playback of some YouTube videos (usually at low framerate) has been fixed. Eventually a better solution will involve supporting edit lists in the GStreamer MSE backend.
Graphics 🖼️
A crash when accessing the diagnostics webkit://gpu page was fixed, making sure we handle the case where libGL.so.1 or libOpenGL.so.0 are missing.
Fixed missing glyph before ZWJ/ZWNJ if no font is found for the cluster.
Releases 📦️
The second unstable releases for the current development cycle have been published: WebKitGTK 2.53.2 and WPE WebKit 2.53.2. Development releases are intended is to gather early feedback on upcoming changes, and as such issue reports are welcome in Bugzilla.
That’s all for this week!
April 28, 2026
Igalia WebKit Team
WebKit Igalia Periodical #63
Update on what happened in WebKit in the week from April 8 to April 28.
After a short hiatus, we return with a galore of releases, more Web Platform improvements, tricky tweaks to thread scheduling, new niceties in the Web Inspector, and new build options to take advantage of compiler optimizations.
Cross-Port 🐱
Delivered a number of changes that have strengthened WPE WebKit and WebKitGTK's behaviour around real-time thread promotion and demotion:
- Real-time soft and hard limits are now set both when
sched_setscheduleror D-Bus based paths are taken (i.e. through rtkit or the corresponding XDG portal), with the soft limit set at 80% of the hard one. - This means WebKit now has time to gracefully handle
SIGXCPU, and will do it in an async-signal-safe manner. - Additionally, the NetworkProcess' Cache Storage thread is now defined as
QOS::UserInitiatedon Linux, which no longer maps to real-time priority. Its earlier mapping to real-time was previously reported as a NetworkProcess crash in the logs (it was in practice a kernel-deliveredSIGKILL, but WebKit doesn't make any distinction while logging). After limits were adjusted, this thread was successfully demoted, and now that the mapping has changed, this is no longer promoted to real-time to begin with.
Finally, logging around portal-related failures has been updated to reduce noise.
Implemented the connectedMoveCallback() for custom elements to react to moveBefore().
Implemented the scaffolding for the moveBefore() DOM function. This is the first step towards implementing the full feature and is currently behind a runtime feature flag.
The Web Inspector now highlights the layout root element by hovering over a Layout event in the “Layout & Rendering” timeline view and reveals it in the element tree by clicking a little “go to” arrow button.
Releases 📦️
WebKitGTK 2.52.2 and WPE WebKit 2.52.2 have been released, which include a number of fixes. In particular, building for some less tested configurations should now be possible, and the WPE port includes fixes for input event handling in the Qt API bindings.
The releases were quickly followed by WebKitGTK 2.52.3 and WPE WebKit 2.52.3, with further fixes including an important patch for crashes in JavaScriptCore on architectures other than x86_64, support for the scrollbar-color CSS property, and a fix for rendering certain emoji glyphs. Additionally, the WPE port also gained a new setting to disable overlay scroll bars and use always-visible ones, fixed focus handling for touch input in the built-in Wayland platform implementation, and a build fix for the Qt one.
In addition to maintenance for the stable branch, the first unstable releases for the current development cycle are also available: WebKitGTK 2.53.1 and WPE WebKit 2.53.1. These are the first published versions that remove the option to use Cairo for 2D rendering—only Skia will be supported going forward. On the additions front, there are graphics subsystem improvements, a few API additions, and initial support in the CMake build system for builds using Profile-Guided Optimization (PGO, needs Clang for now). The goal of development releases is to gather early feedback on upcoming changes, and issue reports are welcome in Bugzilla.
Infrastructure 🏗️
PGO (Profile-Guided Optimization) builds with Clang are now supported by the CMake build system.
That’s all for this week!
April 07, 2026
Igalia WebKit Team
WebKit Igalia Periodical #62
Update on what happened in WebKit in the week from March 31 to April 7.
Support for iOS dialog light dismiss, a new API to obtain page icons, WebKit nightly builds for Epiphany Canary produced by GNOME GitLab, and more conservative checks for MPEG-4 Audio object types are all part of this week's edition of the WebKit periodical.
Cross-Port 🐱
A new API to obtain page icons (a.k.a. “favicons”) has been added to the GTK port. The new functionality reuses the recently added WebKitImage class and provides access to multiple page icons at once through the added WebKitImageList type, allowing applications to better choose an icon that suits their needs. Changes to the WebKitWebView.page-icons property are guaranteed to be done once per page load, when all icon images are available to be used. This new API has been also enabled for the WPE port, and the plan is to deprecate the old page favicon functionality going forward.
Added iOS support for dialog light dismiss, part of the experimental closedby attribute implementation.
Multimedia 🎥
GStreamer-based multimedia support for WebKit, including (but not limited to) playback, capture, WebAudio, WebCodecs, and WebRTC.
canPlayType() is now more conservative regarding MPEG-4 Audio object types. This primarily affects AAC extensions: In the past, as long as there was an AAC decoder installed, WebKit was accepting any codec string that started with mp4a. Now it only accepts codec strings that correspond to object types that have widespread support. This can prevent accidental playback of newer formats like xHE-AAC, which many decoders don't yet support — for example, as of writing, FFmpeg support for xHE-AAC is only very recent and still incomplete.
canPlayType() now also reports support for Dolby AC-4 in systems with a decoder capable of handling it.
The GStreamer WebRTC backend now rejects SDP including rtpmap attributes in the disallowed range of 64-95 payload types. Compliance with RFC 7587 was also improved.
Infrastructure 🏗️
The WebKitGTK nightly builds for Epiphany Canary are now handled entirely by the GNOME GitLab infrastructure, many thanks to them! The previous approach was not optimal, producing release builds without debug symbols. With the new builds, it is now easier to get crash stack traces including more information.
That’s all for this week!
March 30, 2026
Igalia WebKit Team
WebKit Igalia Periodical #61
Update on what happened in WebKit in the week from March 23 to March 30.
This week comes with a mixed bag of new features, incremental improvements, and a new release with the ever important security issue fixes. Also: more blog posts!
Cross-Port 🐱
Implemented initial support for
closedby=any on dialog elements, which adds light dismiss behaviour. This is
behind the ClosedbyAttributeEnabled feature flag.
Added the remaining values for the
experimental closedby attribute implementation.
MiniBrowser now has a
--profile-dir=DIR command line option that can be used to specify a custom
directory where website data and cache can be stored, to test, for example,
behavior in a clean session.
Multimedia 🎥
GStreamer-based multimedia support for WebKit, including (but not limited to) playback, capture, WebAudio, WebCodecs, and WebRTC.
Video decoding limits had been enforced on HTMLMediaElement.canPlayType() so
far, but they are now also enforced in MediaCapabilities
queries.
Graphics 🖼️
Fixed several OpenGL state
restoration bugs in BitmapTexture . These could cause a mismatch between the
GL state assumed by Skia and the actual one, leading to rendering artifacts
with certain GPU drivers and configurations.
The SKIA_DEBUG CMake option has been
enabled for Debug builds, enabling
Skia's internal assertions, debug logging, and consistency checks (e.g. bounds
checking, resource key diagnostics). It remains off by default for Release
and RelWithDebInfo builds, and can still be explicitly configured via
-DSKIA_DEBUG=ON|OFF.
WPE WebKit 📟
WPE Platform API 🧩
New, modern platform API that supersedes usage of libwpe and WPE backends.
The new WPE_SETTING_OVERLAY_SCROLLBARS setting is now
available, and disabling it will use a
more traditional, always visible scrollbar style.
Releases 📦️
A new USE_GSTREAMER build option may now be
used to toggle the features that
require GStreamer at once. This can be used to effectively disable all
multimedia support, which previously needed toggling four CMake options.
WebKitGTK
2.52.1 and
WPE WebKit 2.52.1 have
been released. On top of a small corrections typical of the first point
releases in a new stable series, this one includes a number of fixes for
security issues, and it is a recommended update. The corresponding security
advisory, WSA-2026-0002
(GTK,
WPE) has been published as
well.
Community & Events 🤝
Simón Pena wrote a blog post showing how to create a minimal WPE launcher, which uses a Fedora Podman container with pre-built WPE WebKit libraries and a launcher with barely 10 lines of code to display a web view. This complements Kate Lee's custom HTML context menu blog post from last week.
That’s all for this week!
March 20, 2026
Simón Pena
Getting started with WPE WebKit: a minimal launcher
My colleague Kate recently demonstrated on her blog how simple it is to write a WPE Platform-based launcher, and did so by building it side-by-side with MiniBrowser, inside the WebKit tree.
This entry takes one step back, and demonstrates the same concepts assuming you are not building WPE WebKit yourself, but rather getting it from your distribution. Many of the steps below would apply if you were using a Yocto/OpenEmbedded-based image, but that can be the focus of another post.
Getting WPE WebKit
Get WPE lists a number of options to get WPE from your preferred distribution. At the moment of writing, Fedora, Debian and ArchLinux are your best choices to get a recent version of WPE:
- 2.52 on Fedora
- 2.50 on Debian Forky, 2.52 on Debian Sid
- 2.50 on ArchLinux
However, since WPE Platform hasn’t officially been released, we need to use Fedora, where my colleague Philippe maintains a Copr repository with it enabled.
sudo dnf copr enable -y philn/wpewebkit
sudo dnf install wpewebkit-devel
Alternatively, you can use a container. Here is a Containerfile based on Fedora 42:
FROM fedora:42

RUN dnf install -y \
    dnf-plugins-core \
    && dnf copr enable -y philn/wpewebkit \
    && dnf install -y \
    gcc-c++ \
    cmake \
    pkg-config \
    wpewebkit-devel

WORKDIR /src
Build and run it with:
podman build -t wpe-dev .
podman run -it -e WAYLAND_DISPLAY=$WAYLAND_DISPLAY \
-e XDG_RUNTIME_DIR=/run/user/$(id -u) \
-v $XDG_RUNTIME_DIR/$WAYLAND_DISPLAY:/run/user/$(id -u)/$WAYLAND_DISPLAY \
-v /dev/dri:/dev/dri \
wpe-dev bash
The build system
Kate’s post builds the launcher as part of the WebKit tree using WebKit’s own CMake infrastructure. For a standalone project, we need a self-contained CMakeLists.txt that finds WPE WebKit through pkg-config:
cmake_minimum_required(VERSION 3.16)
project(wpe_sample CXX)

set(CMAKE_CXX_STANDARD 17)

find_package(PkgConfig REQUIRED)

# The Wayland WPE Platform already depends on wpe-platform-2.0
pkg_check_modules(WebKitDeps REQUIRED
    IMPORTED_TARGET
    wpe-webkit-2.0
    wpe-platform-wayland-2.0
)

add_executable(wpe_sample main.cpp)

target_link_libraries(wpe_sample
    PRIVATE
        PkgConfig::WebKitDeps
)
The launcher
Here is a minimal launcher — the smallest amount of code needed to display a web page with WPE WebKit:
#include <wpe/webkit.h>

int main(int argc, const char *argv[]) {
    g_autoptr(GMainLoop) loop = g_main_loop_new(nullptr, false);
    g_autoptr(WebKitWebView) view = WEBKIT_WEB_VIEW(g_object_new(WEBKIT_TYPE_WEB_VIEW,
        nullptr));
    webkit_web_view_load_uri(view,
        (argc > 1) ? argv[1] : "https://wpewebkit.org");
    g_main_loop_run(loop);
    return EXIT_SUCCESS;
}
This snippet relies heavily on default behaviours: it will create a default WPE view, with default top levels, with the default display selection behaviour (Wayland), default context, settings…
Again, Kate’s post does a more realistic job at showing how the various pieces are created and connected together.
Building and running
cmake -B build
cmake --build build
./build/wpe_sample https://wpewebkit.org/

Display backends
WPE WebKit can render to different display backends depending on your environment, which you can select through environment variables:
# Wayland (e.g. desktop, Weston).
WPE_DISPLAY=wpe-display-wayland WAYLAND_DISPLAY=wayland-1 ./build/wpe_sample https://wpewebkit.org/

# DRM/KMS (e.g. embedded, no compositor)
WPE_DISPLAY=wpe-display-drm ./build/wpe_sample https://wpewebkit.org/

# Headless (e.g. testing, CI)
WPE_DISPLAY=wpe-display-headless ./build/wpe_sample https://wpewebkit.org/
You can take a look at wpe_display_get_default() in WPEPlatform/wpe/WPEDisplay.cpp to understand how the automatic selection takes place in the absence of an explicit WPE_DISPLAY request.
(In our example, we are only listing Wayland as a CMake dependency. If libwpewebkit was compiled without DRM or headless support, the environment variable approach would not work.)
Next steps
This is all for now. The next entry in the series will cover classic kiosk features: preventing navigation to unwanted sites, controlling whether new windows can be opened, and intercepting requests through policy decisions.
For a more complete example that includes a custom HTML context menu and JavaScript injection, see Kate’s post.
March 18, 2026
Igalia WebKit Team
WebKit Igalia Periodical #60
Update on what happened in WebKit in the week from March 10 to March 18.
The big ticket item in this week's update are the 2.52.0 releases, which include the work from the last six-month development period, and come with a security advisory. Meanwhile, WPE-Android also gets a release, and a number of featured blog posts.
WPE WebKit 📟
Last week we added support to WPE
MiniBrowser to load settings from a key file. This extended the existing
--config-file=FILE feature, which previously only loaded WPEPlatform
settings under the [wpe-platform] group. Now the feature uses
webkit_settings_apply_from_key_file()
to load properties such as user-agent or enable-developer-extras
from the [websettings] group as well.
Releases 📦️
WebKitGTK 2.52.0 and WPE WebKit 2.52.0 are now available. These include the results of the effort made by the team during the last six months, including rendering improvements and performance optimizations, better security for WebRTC, a more complete WebXR implementation, and a second preview of the WPEPlatform API for the WPE port—among many other changes.
More information about the changes and improvements brought by these major releases can be found at the blog post about WebKitGTK 2.52, and the corresponding one for WPE WebKit 2.52.
Accompanying these releases there is security advisory WSA-2026-0001
(GTK,
WPE), with information
about solved security issues. As usual, we encourage everybody to use the most
recent versions where such issues are known to be fixed.
Bug reports are always welcome at the WebKit Bugzilla.
WPE Android 0.3.3 has been released, and prebuilt packages are available at the Maven Central repository. This is a maintenance release which updates the included WPE WebKit version to 2.50.6 and libsoup to 3.6.6, both of which include security fixes.
Community & Events 🤝
Kate Lee wrote a very interesting blog post showing how to create a small application using the WPEPlatform API to demonstrate one of its newly available features: the Context Menu API. It is rendered entirely as an HTML overlay, enabling richer and more portable context menu implementations.
WebXR support for WebKitGTK and WPE has been reworked and aligned with the modern multi-process architecture, using OpenXR to enable XR device integration on Linux and Android. Sergio Villar wrote a blog post that explains all the work done in the last months around it.
That’s all for this week!
Planet Igalia
Subscribe


Feeds
-
 Adrián Pérez de Castro
-
Alejandro García Castro
-
Andy Wingo
-
Angelos Oikonomopoulos
-
Carlos Alberto López Pérez
-
Carlos García Campos
-
Cathie Chen
-
Claudio Saavedra
-
Diego Pino
-
Enrique Ocaña
-
Frédéric Wang
-
Georges Stavracas
-
Gyuyoung Kim
-
Hironori Fujii
-
Iago Toral
-
Igalia Compilers Team
-
Igalia WebKit Team
-
Javier Fernández
-
Juan José Sánchez Penas
-
Kate Lee
-
Manuel Rego
-
Mario Sanchez Prada
-
Martin Robinson
-
Miguel A. Gómez
-
Nikolas Zimmermann
-
Patrick Griffis
-
Paulo Matos
-
Pawel Lampe
-
Philippe Normand
-
Sergio Villar
-
Simón Pena
-
Vivienne Watermeier
-
Víctor Jáquez
-
WPE WebKit Blog
-
Xabier Rodríguez Calvar
-
Xan López
-
Žan Doberšek
Last updated:
July 19, 2026 11:00 PM
All times are UTC.
Powered by:
![]()