Update on what happened in WebKit in the week from November 3 to November 10.
This week brought a hodgepodge of fixes in Temporal and multimedia,
a small addition to the public API in preparation for future work,
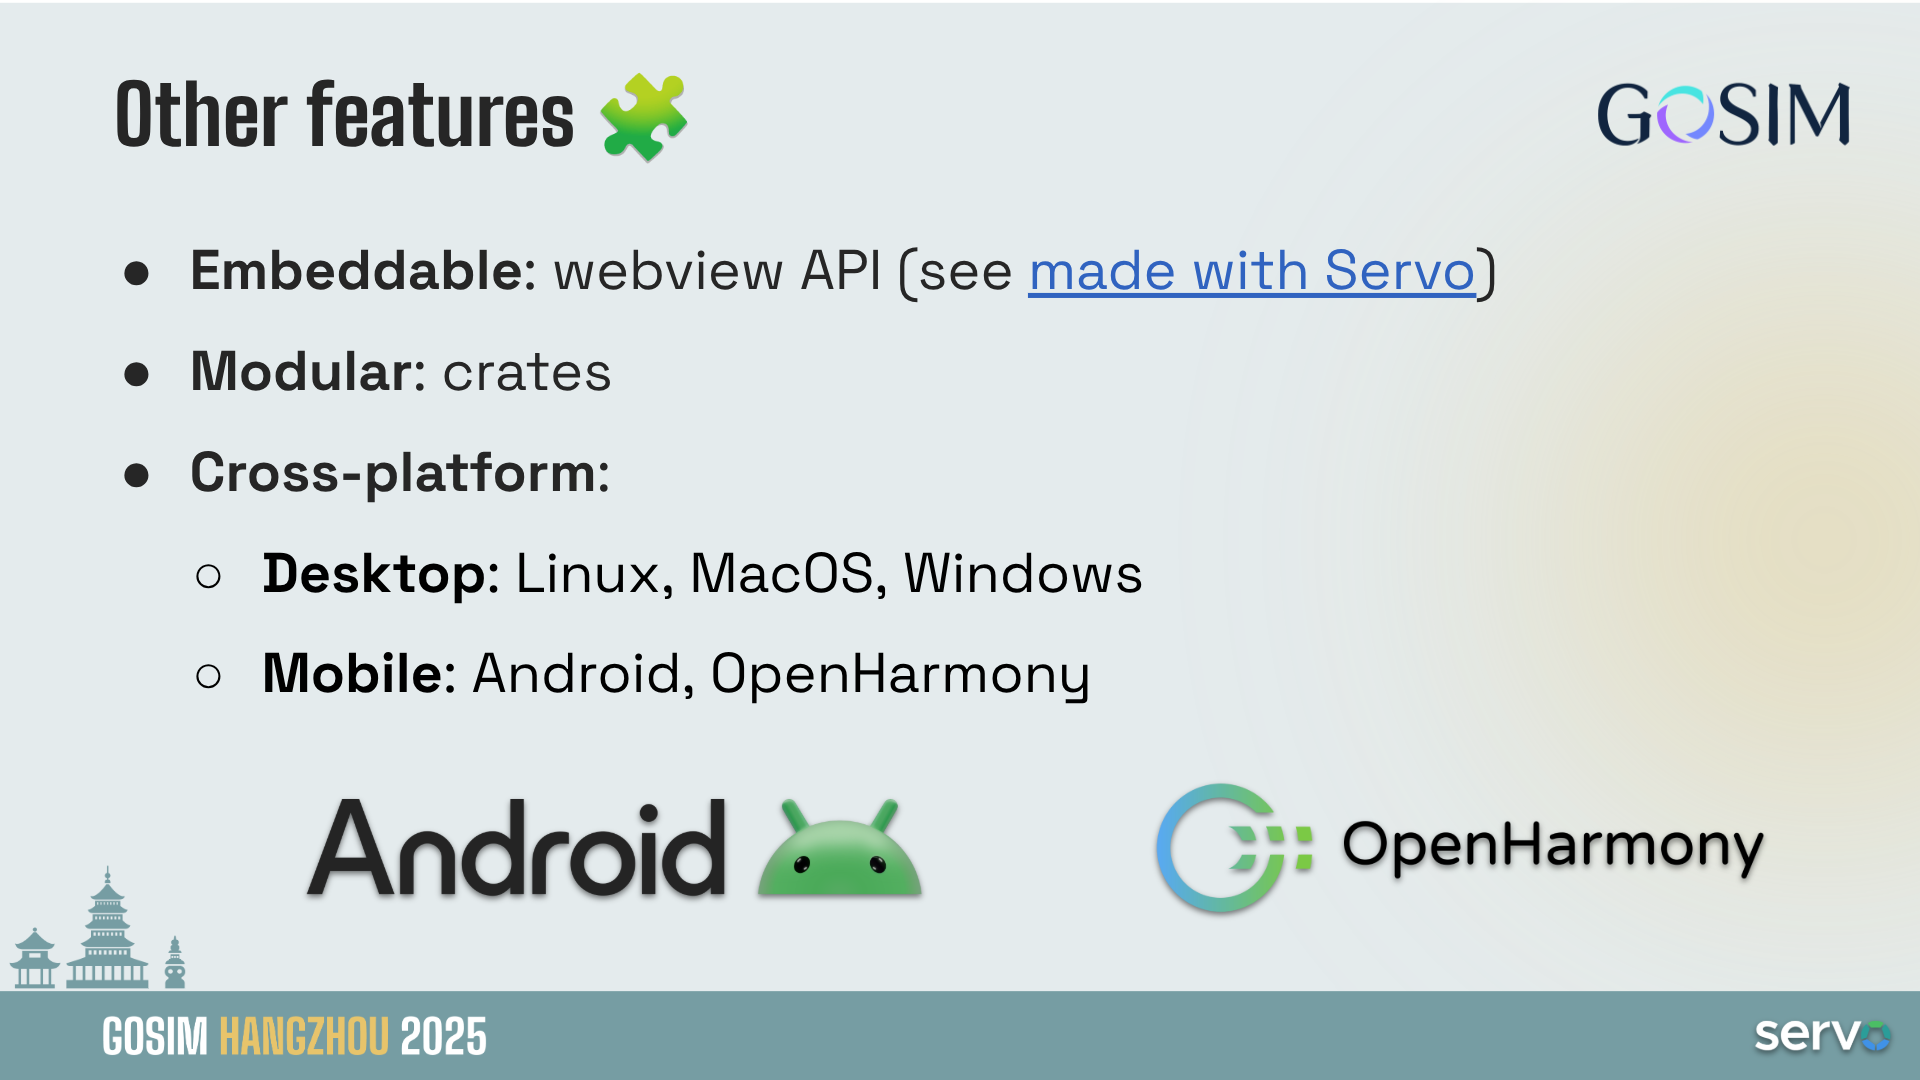
plus advances in WebExtensions, WebXR, and Android support.
Cross-Port 🐱
The platform-independent part of the WebXR Hit Test Module has been implemented. The rest, including the FakeXRDevice mock implementation used for testing will be done later.
On the WebExtensions front, parts of the WebExtensionCallbackHandler code have been rewritten to use more C++ constructs and helper functions, in preparation to share more code among the different WebKit ports.
A new WebKitImage utility class
landed this week. This image
abstraction is one of the steps towards delivering a new improved API for page
favicons, and it is also expected to
be useful for the WebExtensions work, and to enable the webkit_web_view_get_snapshot()
API for the WPE port.
Multimedia 🎥
GStreamer-based multimedia support for WebKit, including (but not limited to) playback, capture, WebAudio, WebCodecs, and WebRTC.
Videos with BT2100-PQ colorspace are now tone-mapped to
SDR in WebKit's compositor, ensuring
colours do not appear washed out.
Adaptation of WPE WebKit targeting the Android operating system.
One of the last pieces needed to have the WPEPlatform API working on Android
has been merged: a custom platform
EGL display implementation, and enabling the default display as fallback.
Community & Events 🤝
The dates for the next Web Engines Hackfest
have been announced: it will take place from Monday, June 15th to Wednesday,
June 17th. As it has been the case in the last years, it will be possible to
attend both on-site, and remotely for those who cannot to travel to A Coruña.
The video recording for Adrian Pérez's “WPE Android 🤖 State of the Bot” talk from this year's edition of the WebKit Contributors' Meeting has been published. This was an update on what the Igalia WebKit team has been done during the last year to improve WPE WebKit on Android, and what is coming up next.
This was the first year I attended Kernel
Recipes and I have nothing but say how
much I enjoyed it and how grateful I’m for the opportunity to talk more about
kworkflow to very experienced kernel developers. What
I mostly like about Kernel Recipes is its intimate format, with only one track
and many moments to get closer to experts and people that you commonly talk
online during your whole year.
The Kernel Recipes audience is a bit different from FOSDEM, with mostly
long-term kernel developers, so I decided to just go directly to the point. I
showed kworkflow being part of the daily life of a typical kernel developer
from the local setup to install a custom kernel in different target machines to
the point of sending and applying patches to/from the mailing list. In short, I
showed how to mix and match kernel workflow recipes end-to-end.
As I was a bit fast when showing some features during my presentation, in this
blog post I explain each slide from my speaker notes. You can see a summary of
this presentation in the Kernel Recipe Live Blog Day 1: morning.
Introduction
Hi, I’m Melissa Wen from Igalia. As we already started sharing kernel recipes
and even more is coming in the next three days, in this presentation I’ll talk
about kworkflow: a cookbook to mix & match kernel recipes end-to-end.
This is my first time attending Kernel Recipes, so lemme introduce myself
briefly.
As I said, I work for Igalia, I work mostly on kernel GPU drivers in the DRM
subsystem.
In the past, I co-maintained VKMS and the v3d driver. Nowadays I focus on the
AMD display driver, mostly for the Steam Deck.
Besides code, I contribute to the Linux kernel by mentoring several newcomers
in Outreachy, Google Summer of Code and Igalia Coding Experience. Also, by
documenting and tooling the kernel.
And what’s this cookbook called kworkflow?
Kworkflow (kw)
Kworkflow is a tool created by Rodrigo Siqueira, my colleague at Igalia. It’s a
single platform that combines software and tools to:
optimize your kernel development workflow;
reduce time spent in repetitive tasks;
standardize best practices;
ensure that deployment data flows smoothly and reliably between different
kernel workflows;
It’s mostly done by volunteers, kernel developers using their spare time. Its
features cover real use cases according to kernel developer needs.
Basically it’s mixing and matching the daily life of a typical kernel developer
with kernel workflow recipes with some secret sauces.
First recipe: A good GPU driver for my AMD laptop
So, it’s time to start the first recipe: A good GPU driver for my AMD laptop.
Before starting any recipe we need to check the necessary ingredients and
tools. So, let’s check what you have at home.
With kworkflow, you can use:
kw device: to get information about the target machine, such as: CPU model,
kernel version, distribution, GPU model,
kw remote: to set the address of this machine for remote access
kw config: you can configure kw with kw config. With this command you can
basically select the tools, flags and preferences that kw will use to build
and deploy a custom kernel in a target machine. You can also define recipients
of your patches when sending it using kw send-patch. I’ll explain more about
each feature later in this presentation.
kw kernel-config manager (or just kw k): to fetch the kernel .config file
from a given machine, store multiple .config files, list and retrieve them
according to your needs.
Now, with all ingredients and tools selected and well portioned, follow the
right steps to prepare your custom kernel!
First step: Mix ingredients with kw build or just kw b
kw b and its options wrap many routines of compiling a custom kernel.
You can run kw b -i to check the name and kernel version and the number
of modules that will be compiled and kw b --menu to change kernel
configurations.
You can also pre-configure compiling preferences in kw config regarding
kernel building. For example, target architecture, the name of the
generated kernel image, if you need to cross-compile this kernel for a
different system and which tool to use for it, setting different warning
levels, compiling with CFlags, etc.
Then you can just run kw b to compile the custom kernel for a target
machine.
Second step: Bake it with kw deploy or just kw d
After compiling the custom kernel, we want to install it in the target machine.
Check the name of the custom kernel built: 6.17.0-rc6 and with kw s SSH
access the target machine and see it’s running the kernel from the Debian
distribution 6.16.7+deb14-amd64.
As with building settings, you can also pre-configure some deployment settings,
such as compression type, path to device tree binaries, target machine (remote,
local, vm), if you want to reboot the target machine just after deploying your
custom kernel, and if you want to boot in the custom kernel when restarting the
system after deployment.
If you didn’t pre-configured some options, you can still customize as a command
option, for example: kw d --reboot will reboot the system after deployment,
even if I didn’t set this in my preference.
With just running kw d --reboot I have installed the kernel in a given target
machine and rebooted it. So when accessing the system again I can see it was
booted in my custom kernel.
Third step: Time to taste with kw debug
kw debug wraps many tools for validating a kernel in a target machine. We
can log basic dmesg info but also tracking events and ftrace.
With kw debug --dmesg --history we can grab the full dmesg log from a
remote machine, if you use the --follow option, you will monitor dmesg
outputs. You can also run a command with kw debug --dmesg --cmd="<my
command>" and just collect the dmesg output related to this specific execution
period.
In the example, I’ll just unload the amdgpu driver. I use kw drm
--gui-off to drop the graphical interface and release the amdgpu for
unloading it. So I run kw debug --dmesg --cmd="modprobe -r amdgpu" to unload
the amdgpu driver, but it fails and I couldn’t unload it.
Cooking Problems
Oh no! That custom kernel isn’t tasting good. Don’t worry, as in many recipes
preparations, we can search on the internet to find suggestions on how to make
it tasteful, alternative ingredients and other flavours according to your
taste.
With kw patch-hub you can search on the lore kernel mailing list for possible
patches that can fix your kernel issue. You can navigate in the mailing lists,
check series, bookmark it if you find it relevant and apply it in your local
kernel tree, creating a different branch for tasting… oops, for testing. In
this example, I’m opening the amd-gfx mailing list where I can find
contributions related to the AMD GPU driver, bookmark and/or just apply the
series to my work tree and with kw bd I can compile & install the custom kernel
with this possible bug fix in one shot.
As I changed my kw config to reboot after deployment, I just need to wait for
the system to boot to try again unloading the amdgpu driver with kw debug
--dmesg --cm=modprobe -r amdgpu. From the dmesg output retrieved by kw for
this command, the driver was unloaded, the problem is fixed by this series and
the kernel tastes good now.
If I’m satisfied with the solution, I can even use kw patch-hub to access the
bookmarked series and marking the checkbox that will reply the patch thread
with a Reviewed-by tag for me.
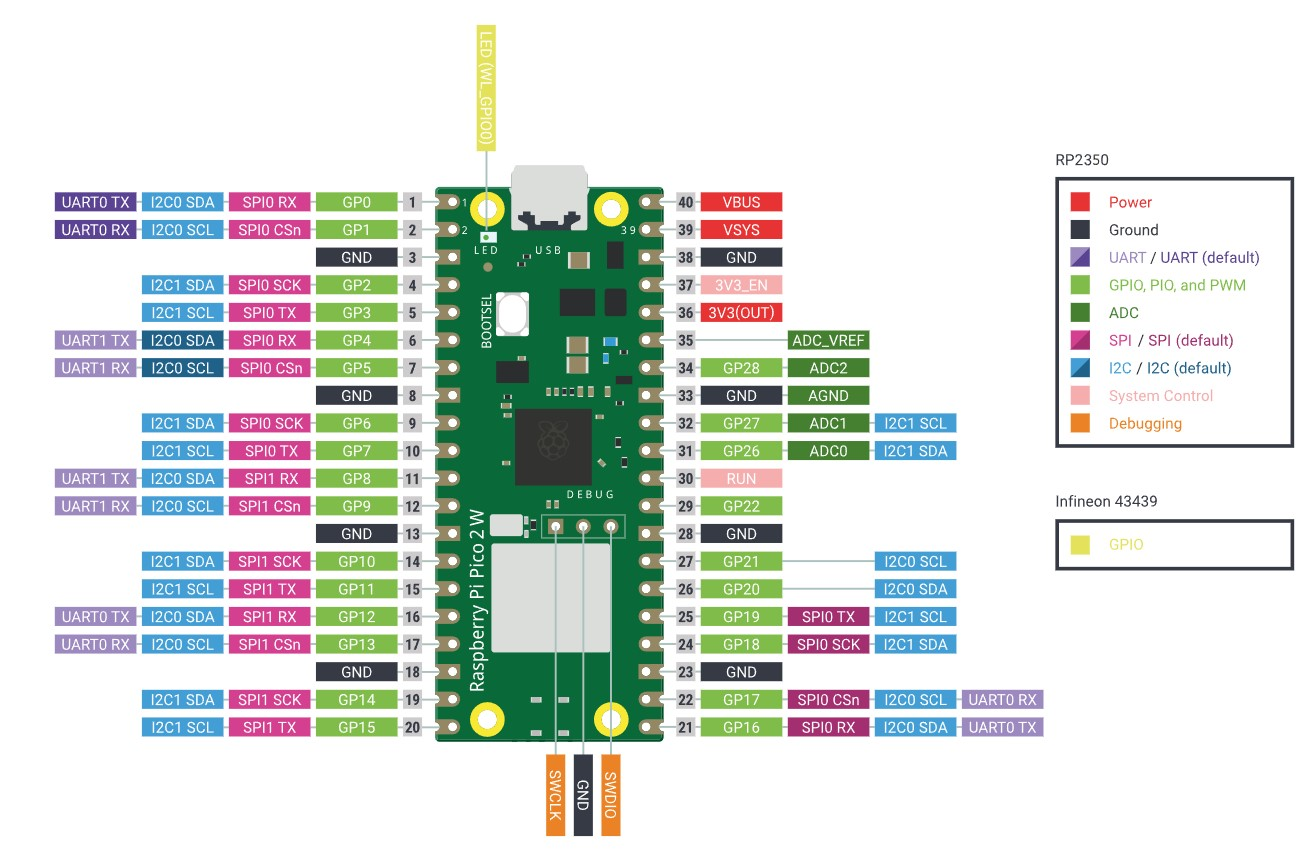
Second Recipe: Raspberry Pi 4 with Upstream Kernel
As in all recipes, we need ingredients and tools, but with kworkflow you can
get everything set as when changing scenarios in a TV show. We can use kw env
to change to a different environment with all kw and kernel configuration set
and also with the latest compiled kernel cached.
I was preparing the first recipe for a x86 AMD laptop and with kw env --use
RPI_64 I use the same worktree but moved to a different kernel workflow, now
for Raspberry Pi 4 64 bits. The previous compiled kernel 6.17.0-rc6-mainline+
is there with 1266 modules, not the 6.17.0-rc6 kernel with 285 modules that I
just built&deployed. kw build settings are also different, now I’m targeting
a arm64 architecture with a cross-compiled kernel using aarch64-linu-gnu-
cross-compilation tool and my kernel image calls kernel8 now.
If you didn’t plan for this recipe in advance, don’t worry. You can create a
new environment with kw env --create RPI_64_V2 and run kw init --template
to start preparing your kernel recipe with the mirepoix ready.
I mean, with the basic ingredients already cut…
I mean, with the kw configuration set from a template.
And you can use kw remote to set the IP address of your target machine and
kw kernel-config-manager to fetch/retrieve the .config file from your target
machine. So just run kw bd to compile and install a upstream kernel for
Raspberry Pi 4.
Third Recipe: The Mainline Kernel Ringing on my Steam Deck (Live Demo)
Let’s show you how easy is to build, install and test a custom kernel for Steam
Deck with Kworkflow. It’s a live demo, but I also recorded it because I know
the risks I’m exposed to and something can go very wrong just because of
reasons :)
Report: how was the live demo
For this live demo, I took my OLED Steam Deck to the stage. I explained that,
if I boot mainline kernel on this device, there is no audio. So I turned it on
and booted the mainline kernel I’ve installed beforehand. It was clear that
there was no typical Steam Deck startup audio when the system was loaded.
As I started the demo in the kw environment for Raspberry Pi 4, I first moved
to another environment previously used for Steam Deck. In this STEAMDECK
environment, the mainline kernel was already compiled and cached, and all
settings for accessing the target machine, compiling and installing a custom
kernel were retrieved automatically.
My live demo followed these steps:
With kw env --use STEAMDECK, switch to a kworkflow environment for Steam
Deck kernel development.
With kw b -i, shows that kw will compile and install a kernel with 285
modules named 6.17.0-rc6-mainline-for-deck.
Run kw config to show that, in this environment, kw configuration changes
to x86 architecture and without cross-compilation.
Run kw device to display information about the Steam Deck device, i.e. the
target machine. It also proves that the remote access - user and IP - for
this Steam Deck was already configured when using the STEAMDECK environment, as
expected.
Using git am, as usual, apply a hot fix on top of the mainline kernel.
This hot fix makes the audio play again on Steam Deck.
With kw b, build the kernel with the audio change. It will be fast because
we are only compiling the affected files since everything was previously
done and cached. Compiled kernel, kw configuration and kernel configuration is
retrieved by just moving to the “STEAMDECK” environment.
Run kw d --force --reboot to deploy the new custom kernel to the target
machine. The --force option enables us to install the mainline kernel even
if mkinitcpio complains about missing support for downstream packages when
generating initramfs. The --reboot option makes the device reboot the Steam
Deck automatically, just after the deployment completion.
After finishing deployment, the Steam Deck will reboot on the new custom
kernel version and made a clear resonant or vibrating sound. [Hopefully]
Finally, I showed to the audience that, if I wanted to send this patch
upstream, I just needed to run kw send-patch and kw would automatically add
subsystem maintainers, reviewers and mailing lists for the affected files as
recipients, and send the patch to the upstream community assessment. As I
didn’t want to create unnecessary noise, I just did a dry-run with kw
send-patch -s --simulate to explain how it looks.
What else can kworkflow already mix & match?
In this presentation, I showed that kworkflow supported different kernel
development workflows, i.e., multiple distributions, different bootloaders and
architectures, different target machines, different debugging tools and
automatize your kernel development routines best practices, from development
environment setup and verifying a custom kernel in bare-metal to sending
contributions upstream following the contributions-by-e-mail structure. I
exemplified it with three different target machines: my ordinary x86 AMD laptop
with Debian, Raspberry Pi 4 with arm64 Raspbian (cross-compilation) and the
Steam Deck with SteamOS (x86 Arch-based OS). Besides those distributions,
Kworkflow also supports Ubuntu, Fedora and PopOS.
Now it’s your turn: Do you have any secret recipes to share? Please share
with us via kworkflow.
Update on what happened in WebKit in the week from October 27 to November 3.
A calmer week this time! This week we have the GTK and WPE ports implementing
the RunLoopObserver infrastructure, which enables more sophisticated scheduling
in WebKit Linux ports, as well as more information in webkit://gpu. On the Trusted
Types front, the timing of check was changed to align with spec changes.
Cross-Port 🐱
Implemented the RunLoopObserver
infrastructure for GTK and WPE ports, a critical piece of technology previously
exclusive to Apple ports that enables sophisticated scheduling features like
OpportunisticTaskScheduler for optimal garbage collection timing.
The implementation refactored the GLib run loop to notify clients about
activity-state transitions (BeforeWaiting, Entry, Exit, AfterWaiting),
then moved from timer-based to
observer-based layer flushing for more
precise control over rendering updates. Finally support was added to support
cross-thread scheduling of RunLoopObservers, allowing the ThreadedCompositor
to use them, enabling deterministic
composition notifications across thread boundaries.
Changed timing of Trusted Types
checks within DOM attribute handling to align with spec changes.
Graphics 🖼️
The webkit://gpu page now showsmoreinformation like the list of
preferred buffer formats, the list of supported buffer formats, threaded
rendering information, number of MSAA samples, view size, and toplevel state.
It is also now possible to make the
page autorefresh every the given amount of seconds by passing a
?refresh=<seconds> parameter in the URL.
Hey hey hey good evening! Tonight a quick note on
wastrel, a new WebAssembly
implementation.
a wasm-to-native compiler that goes through c
Wastrel compiles Wasm modules to standalone binaries. It does so by
emitting C and then compiling that C.
Compiling Wasm to C isn’t new: Ben Smith
wrote wasm2c
back in the day and these days most people in this space use Bastien
Müller‘s w2c2.
These are great projects!
Wastrel has two or three minor differences from these projects. Let’s
lead with the most important one, despite the fact that it’s as yet
vaporware: Wastrel aims to support automatic memory managment via
WasmGC, by embedding the Whippet
garbage collection library. (For the
wingolog faithful, you can think of Wastrel as a
Whiffle
for Wasm.) This is the whole point! But let’s come back to it.
The other differences are minor. Firstly, the CLI is more like
wasmtime: instead of privileging the production
of C, which you then incorporate into your project, Wastrel also
compiles the C (by default), and even runs it, like wasmtime run.
Unlike wasm2c (but like w2c2), Wastrel implements
WASI. Specifically, WASI 0.1, sometimes known as
“WASI preview 1”. It’s nice to be able to take the
wasi-sdk‘s C compiler,
compile your program to a binary that uses WASI imports, and then run it
directly.
In a past life, I once took a week-long sailing course on a 12-meter
yacht. One thing that comes back to me often is the way the instructor
would insist on taking in the bumpers immediately as we left port, that
to sail with them was no muy marinero, not very seamanlike. Well one
thing about Wastrel is that it emits nice C: nice in the sense that it
avoids many useless temporaries. It does so with a lightweight effects
analysis,
in which as temporaries are produced, they record which bits of the
world they depend on, in a coarse way: one bit for the contents of all
global state (memories, tables, globals), and one bit for each local.
When compiling an operation that writes to state, we flush all
temporaries that read from that state (but only that state). It’s a
small thing, and I am sure it has very little or zero impact after
SROA turns locals into
SSA values, but we are vessels of the divine, and it is important for
vessels to be C worthy.
Finally, w2c2 at least is built in such a way that you can instantiate a
module multiple times. Wastrel doesn’t do that: the Wasm instance is
statically allocated, once. It’s a restriction, but that’s the use case
I’m going for.
on performance
Oh buddy, who knows?!? What is real anyway? I would love to have
proper perf tests, but in the meantime, I compiled
coremark using my GCC on x86-64
(-02, no other options), then also compiled it with the current wasi-sdk
and then ran with w2c2, wastrel, and wasmtime. I am well aware of the
many pitfalls of benchmarking, and so I should not say anything because
it is irresponsible to make conclusions from useless microbenchmarks.
However, we’re all friends here, and I am a dude with hubris who also
believes blogs are better out than in, and so I will give some small
indications. Please obtain your own salt.
So on coremark, Wastrel is some 2-5% percent slower than native, and
w2c2 is some 2-5% slower than that. Wasmtime is 30-40% slower than GCC.
Voilà.
My conclusion is, Wastrel provides state-of-the-art performance. Like
w2c2. It’s no wonder, these are simple translators that use industrial
compilers underneath. But it’s neat to see that performance is close to
native.
on wasi
OK this is going to sound incredibly arrogant but here it is: writing
Wastrel was easy. I have worked on Wasm for a while, and on Firefox’s
baseline
compiler,
and Wastrel is kinda like a baseline compiler in shape: it just has to
avoid emitting boneheaded code, and can leave the serious work to
someone else (Ion in the case of Firefox, GCC in the case of Wastrel).
I just had to use the Wasm libraries I already
had and
make it emit some C for each instruction. It took 2 days.
WASI, though, took two and a half weeks of agony. Three reasons: One,
you can be sloppy when implementing just wasm, but when you do WASI you
have to implement an ABI using sticks and glue, but you have no glue,
it’s all just i32. Truly excruciating, it makes you doubt everything,
and I had to refactor Wastrel to use C’s meager type system to the max.
(Basically, structs-as-values to avoid type confusion, but via inline
functions to avoid overhead.)
Two, WASI is not huge but not tiny either. Implementing
poll_oneoff
is annoying. And so on. Wastrel’s WASI
implementation
is thin but it’s still a couple thousand lines of code.
Three, WASI is underspecified, and in practice what is “conforming” is a
function of what the Rust and C toolchains produce. I used
wasi-testsuite to burn
down most of the issues, but it was a slog. I neglected email and
important things but now things pass so it was worth it maybe? Maybe?
on wasi’s filesystem sandboxing
WASI preview 1 has this
“rights”
interface that associated capabilities with file descriptors. I think
it was an attempt at replacing and expanding file permissions with a
capabilities-oriented security approach to sandboxing, but it was only a
veneer. In practice most WASI implementations effectively implement the
sandbox via a permissions layer: for example the process has
capabilities to access the parents of preopened directories via ..,
but the WASI implementation has to actively prevent this capability from
leaking to the compiled module via run-time checks.
Wastrel takes a different approach, which is to use Linux’s filesystem
namespaces to build a tree in which only the exposed files are
accessible. No run-time checks are necessary; the system is secure by
construction. He says. It’s very hard to be categorical in this domain
but a true capabilities-based approach is the only way I can have any
confidence in the results, and that’s what I did.
The upshot is that Wastrel is only for Linux. And honestly, if you are
on MacOS or Windows, what are you doing with your life? I get that it’s
important to meet users where they are but it’s just gross to build on a
corporate-controlled platform.
The current versions of WASI keep a vestigial capabilities-based API,
but given that the goal is to compile POSIX programs, I would prefer if
wasi-filesystem leaned
into the approach of WASI just having access to a filesystem instead of
a small set of descriptors plus scoped openat, linkat, and so on
APIs. The security properties would be the same, except with fewer bug
possibilities and with a more conventional interface.
on wtf
So Wastrel is Wasm to native via C, but with an as-yet-unbuilt GC aim.
Why?
This is hard to explain and I am still workshopping it.
Firstly I am annoyed at the WASI working group’s focus on shared-nothing
architectures as a principle of composition. Yes, it works, but garbage
collection also works; we could be building different, simpler systems
if we leaned in to a more capable virtual machine. Many of the problems
that WASI is currently addressing are ownership-related, and would be
comprehensively avoided with automatic memory management. Nobody is
really pushing for GC in this space and I would like for people to be
able to build out counterfactuals to the shared-nothing orthodoxy.
Secondly there are quite a number of languages that are targetting
WasmGC these days, and it would be nice for them to have a good run-time
outside the browser. I know that Wasmtime is working on GC, but it
needs competition :)
Finally, and selfishly, I have a GC library! I would love to spend more
time on it. One way that can happen is for it to prove itself useful,
and maybe a Wasm implementation is a way to do that. Could Wastrel on
wasm_of_ocaml output beat
ocamlopt? I don’t know but it would be worth it to find out! And I
would love to get Guile programs compiled to native, and perhaps with
Hoot and Whippet and Wastrel that is a
possibility.
Welp, there we go, blog out, dude to bed. Hack at y’all later and
wonderful wasming to you all!
Previously on meyerweb, I crawled through a way to turn parenthetical comments into sidenotes, which I called “asidenotes”. As a recap, these are inline asides in parentheses, which is something I like to do. The constraints are that the text has to start inline, with its enclosing parentheses as part of the static content, so that the parentheses are present if CSS isn’t applied, but should lose those parentheses when turned into asidenotes, while also adding a sentence-terminating period when needed.
At the end of that post, I said I wouldn’t use the technique I developed, because the markup was too cluttered and unwieldy, and there were failure states that CSS alone couldn’t handle. So what can we do instead? Extend HTML to do things automatically!
If you’ve read my old post “Blinded By the DOM Light”, you can probably guess how this will go. Basically, we can write a little bit of JavaScript to take an invented element and Do Things To It. What things? Anything JavaScript makes possible.
So first, we need an element, one with a hyphen in the middle of its name (because all custom elements require an interior hyphen, similar to how all custom properties and most custom identifiers in CSS require two leading dashes). Something like:
<aside-note>(actual text content)</aside-note>
Okay, great! Thanks to HTML’s permissive handling of unrecognized elements, this completely new element will be essentially treated like a <span> in older browsers. In newer browsers, we can massage it.
class asideNote extends HTMLElement {
	connectedCallback() {
		let marker = document.createElement('sup');
		marker.classList.add('asidenote-marker');
		this.after(marker);
	}
}
customElements.define("aside-note",asideNote);
With this in place, whenever a supporting browser encounters an <aside-note> element, it will run the JS above. Right now, what that does is insert a <sup> element just after the <aside-note>.
“Whoa, wait a minute”, I thought to myself at this point. “There will be browsers (mostly older browser versions) that understand custom elements, but don’t support anchor positioning. I should only run this JS if the browser can position with anchors, because I don’t want to needlessly clutter the DOM. I need an @supports query, except in JS!” And wouldn’t you know it, such things do exist.
class asideNote extends HTMLElement {
	connectedCallback() {
		if (CSS.supports('bottom','anchor(top)')) {
			let marker = document.createElement('sup');
			marker.classList.add('asidenote-marker');
			this.after(marker);
		}
	}
}
I went through a lot of that CSS in the previous post, so jump over there to get details on what all that means if the above has you agog. I did add a few bits of text styling like an explicit line height and slight size reduction, and changed all the asidenote classes there to aside-note elements here, but nothing is different with the positioning and such.
Let’s go back to the JavaScript, where we can strip off the leading and trailing parentheses with relative ease.
class asideNote extends HTMLElement {
	connectedCallback() {
		if (CSS.supports('bottom','anchor(top)')) {
			let marker = document.createElement('sup');
			marker.classList.add('asidenote-marker');
			this.after(marker);
			let inner = this.innerText;
			if (inner.slice(0,1) == '(' && inner.slice(-1) == ')') {
				inner = inner.slice(1,inner.length-1);}
			this.innerText = inner;
		}
	}
}
This code looks at the innerText of the asidenote, checks to see if it both begins and ends with parentheses (which all asidenotes should!), and then if so, it strips them out of the text and sets the <aside-note>’s innerText to be that stripped string. I decided to set it up so that the stripping only happens if there are balanced parentheses because if there aren’t, I’ll see that in the post preview and fix it before publishing.
I still haven’t added the full stop at the end of the asidenotes, nor have I accounted for asidenotes that end in punctuation, so let’s add in a little bit more code to check for and do that:
class asideNote extends HTMLElement {
	connectedCallback() {
		if (CSS.supports('bottom','anchor(top)')) {
			let marker = document.createElement('sup');
			marker.classList.add('asidenote-marker');
			this.after(marker);
			let inner = this.innerText;
			if (inner.slice(0,1) == '(' && inner.slice(-1) == ')') {
				inner = inner.slice(1,inner.length-1);}
			if (!isLastCharSpecial(inner)) {
				inner += '.';}
			this.innerText = inner;
		}
	}
}
function isLastCharSpecial(str) {
	const punctuationRegex = /[!/?/‽/.\\]/;
	return punctuationRegex.test(str.slice(-1));
}
And with that, there is really only one more point of concern: what will happen to my asidenotes in mobile contexts? Probably be positioned just offscreen, creating a horizontal scrollbar or just cutting off the content completely. Thus, I don’t just need a supports query in my JS. I also need a media query. It’s a good thing those also exist!
class asideNote extends HTMLElement {
	connectedCallback() {
		if (CSS.supports('bottom','anchor(top)') &&
			window.matchMedia('(width >= 65em)').matches) {
			let marker = document.createElement('sup');
			marker.classList.add('asidenote-marker');
			this.after(marker);
Adding that window.matchMedia to the if statement’s test means all the DOM and content massaging will be done only if the browser understands anchor positioning and the window width is above 65 ems, which is my site’s first mobile media breakpoint that would cause real layout problems. Otherwise, it will leave the asidenote content embedded and fully parenthetical. Your breakpoint will very likely differ, but the principle still holds.
The one thing about this JS is that the media query only happens when the custom element is set up, same as the support query. There are ways to watch for changes to the media environment due to things like window resizes, but I’m not going to use them here. I probably should, but I’m still not going to.
So: will I use this version of asidenotes on meyerweb? I might, Rabbit, I might. I mean, I’m already using them in this post, so it seems like I should just add the JS to my blog templates and the CSS to my stylesheets so I can keep doing this sort of thing going forward. Any objections? Let’s hear ’em!
Update on what happened in WebKit in the week from October 21 to October 28.
This week has again seen a spike in activity related to WebXR and graphics
performance improvements. Additionally, we got in some MathML additions, a
fix for hue interpolation, a fix for WebDriver screenshots, development
releases, and a blog post about memory profiling.
Cross-Port 🐱
Support for WebXR Layers has seen the
very firstchanges
needed to have them working on WebKit.
This is expected to take time to complete, but should bring improvements in
performance, rendering quality, latency, and power consumption down the road.
Work has started on the WebXR Hit Test
Module, which will allow WebXR
experiences to check for real world surfaces. The JavaScript API bindings were
added, followed by an initial XRRay
implementation. More work is needed to
actually provide data from device sensors.
Now that the WebXR implementation used for the GTK and WPE ports is closer to
the Cocoa ones, it was possible to unify the
code used to handle opaque buffers.
Implemented the text-transform: math-auto CSS property, which replaces the legacy mathvariant system and is
used to make identifiers italic in MathML Core.
Implemented the math-depth CSS
extension from MathML Core.
Graphics 🖼️
The hue interpolation
method
for gradients has been fixed. This is
expected to be part of the upcoming 2.50.2 stable release.
Paths that contain a single arc, oval, or line have been changed to use a
specialized code path, resulting in
improved performance.
WebGL content rendering will be handled by a new isolated process (dubbed “GPU
Process”) by default. This is the
first step towards moving more graphics processing out of the process that
handles processing Web content (the “Web Process”), which will result in
increased resilience against buggy graphics drivers and certain kinds of
malicious content.
The internal webkit://gpu page has been
improved to also display information
about the graphics configuration used in the rendering process.
WPE WebKit 📟
WPE Platform API 🧩
New, modern platform API that supersedes usage of libwpe and WPE backends.
The new WPE Platform, when using Skia (the default), now takes WebDriver
screenshots in the UI Process, using
the final assembled frame that was sent to the system compositor. This fixes
the issues of some operations like 3D CSS animations that were not correctly
captured in screenshots.
Releases 📦️
The first development releases for the current development cycle have been
published: WebKitGTK
2.51.1 and
WPE WebKit 2.51.1. These
are intended to let third parties test upcoming features and improvements and
as such bug reports for those are particularly welcome in
Bugzilla. We are particularly interested in reports
related to WebGL, now that it is handled in an isolated process.
Community & Events 🤝
Paweł Lampe has published a blog post that discusses GTK/WPE WebKit memory profiling using industry-standard tools and a built-in "Malloc Heap Breakdown" WebKit feature.
It’s not really a secret I have a thing for sidenotes, and thus for CSS anchored positioning. But a thing I realized about myself is that most of my sidenotes are likely to be tiny asides commenting on the main throughline of the text, as opposed to bibliographic references or other things that usually become actual footnotes or endnotes. The things I would sidenote currently get written as parenthetical inline comments (you know, like this). Asidenotes, if you will.
Once I had realized that, I wondered: could I set up a way to turn those parenthetical asides into asidenotes in supporting browsers, using only HTML and CSS? As it turns out, yes, though not in a way I would actually use. In fact, the thing I eventually arrived at is pretty terrible.
Okay, allow me to explain.
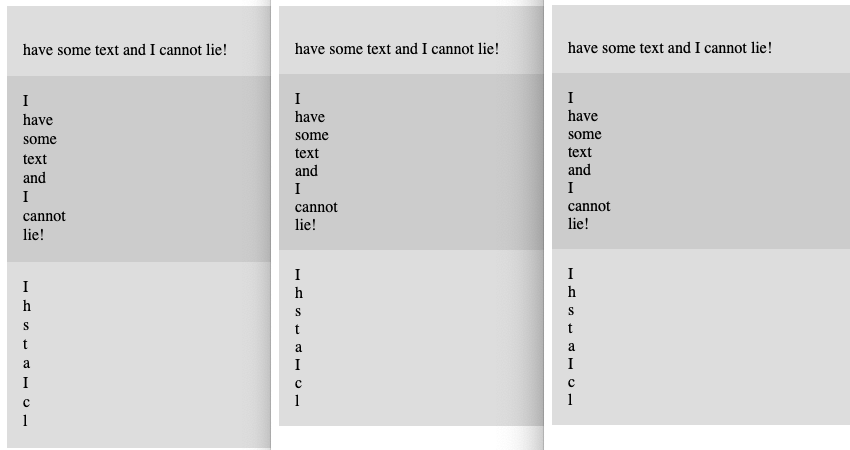
To be crystal clear about this, here’s how I would want one of these parenthetical asides to be rendered in browsers that don’t support anchored positioning, and then how to render in those that do (which are, as I write this, recent Chromium browsers and Safari Technology Previews; see theanchor() MDN page for the latest):
A parenthetical sitting inline (top) and turned into an asidenote (bottom).
My thinking is, the parenthetical text should be the base state, with some HTML to flag the bit that’s an asidenote, and then CSS is applied in supporting browsers to lay out the text as an asidenote. There is a marker pair to allow an unambiguous association between the two, which is tricky, because that marker should not be in the base text, but should appear when styled.
I thought for a minute that I would wrap these little notes in <aside>s, but quickly realized that would probably be a bad idea for accessibility and other reasons. I mean, I could use CSS to cast the <aside> to an inline box instead of its browser-default block box, but I’d need to label each one separately, be very careful with roles, and so on and so on. It was just the wrong tool, it seemed to me. (Feel free to disagree with me in the comments!)
So, I started with this:
<span class="asidenote">(Feel free to disagree with me in the comments!)</span>
That wasn’t going to be enough, though, because I can certainly position this <span>, but there’s nothing available to leave a maker behind when I do! Given the intended result, then, there needs to be something in the not-positioned text that serves in that role (by which I mean a utility role, not an ARIA role). Here’s where my mind went:
<span class="asidenote">(by which I mean a utility role, not an ARIA role)</span><sup></sup>
The added <sup> is what will contain the marker text, like 1 or a or whatever.
This seemed like it was the minimum viable structure, so I started writing some styles. These asidenotes would be used in my posts, and I’d want the marker counters to reset with each blog post, so I built the selectors accordingly:
So far, I’ve set a named anchor on the <main> element (which has an id of thoughts) that encloses a page’s content, reset a counter on each <article>, and inserted that counter as the ::before content for both the asidenotes’ <span>s and the <sup>s that follow them. That done, it’s time to actually position the asidenotes:
Here, each class="asidenote" element increments the asidenotes counter by one, and then the asidenote is absolutely positioned so its top is placed at the larger value of two-thirds of an em below the bottom of the previous asidenote, if any; or else the top of its implicit anchor, which, because I didn’t set an explicit named anchor for it in this case, seems to be the place it would have occupied in the normal flow of the text. This latter bit is long-standing behavior in absolute positioning of inline elements, so it makes sense. I’m just not sure it fully conforms to the specification, though it’s particularly hard for me to tell in this case.
Moving on! The left edge of the asidenote is set 4em to the right of the right edge of --main and then some formatting stuff is done to keep it balanced and nicely sized for its context. Some of you will already have seen what’s going to happen here.
An asidenote with some typographic decoration it definitely should not have in this context.
Yep, the parentheses came right along with the text, and in general the whole thing looks a little odd. I could certainly argue that these are acceptable design choices, but it’s not what I want to see. I want the parentheses to go away when laid out as a asidenote, and also capitalize the first letter if it isn’t already, plus close out the text with a full stop.
And this is where the whole thing tipped over into “I don’t love this” territory. I can certainly add bits of text before and after an element’s content with pseudo-elements, but I can’t subtract bits of text (not without JavaScript, anyway). The best I can do is suppress their display, but for that, I need structure. So I went this route with the markup and CSS:
<span class="asidenote"><span>(</span>by which I mean a utility role, not an ARIA role<span>)</span></span><sup></sup>
I could have used shorter elements like <b> or <i>, and then styled them to look normal, but nah. I don’t love the clutter, but <span> makes more sense here.
With those parentheses gone, I can uppercase the the first visible letter and full-stop the end of each asidenote like so:
…and that’s more or less it (okay, yes, there are a few other tweaks to the markers and their sizes and line heights and asidenote text size and blah blah blah, but let’s not clutter up the main points by slogging through all that). With that, I get little asides that are parenthetical in the base text, albeit with a bunch of invisible-to-the-user markup clutter, that will be progressively enhanced into full asidenotes where able.
There’s an extra usage trap here, as well: if I always generate a full stop at the end, it means I should never end my asidenotes with a question mark, exclamation point, interrobang, or other sentence-ending character. But those are things I like to do!
So, will I use this on meyerweb? Heck to the no. The markup clutter is much more annoying than the benefit, it fumbles on some pretty basic use cases, and I don’t really want to go to the lengths of creating weird bespoke text macros — or worse, try to fork and extend a local Markdown parser to add some weird bespoke text pattern — just to make this work. If CSS had a character selector that let me turn off the parentheses without needing the extras <span>s, and some kind of outside-the-element generated content, then maybe yes. Otherwise, no, this is not how I’d do it, at least outside this post. At the very least, some JavaScript is needed to remove bits of text and decide whether to append the full stop.
Given that JS is needed, how would I do it? With custom elements and the Light DOM, which I’ll document in the next post. Stay tuned!
One of the main constraints that embedded platforms impose on the browsers is a very limited memory. Combined with the fact that embedded web applications tend to run actively for days, weeks, or even longer,
it’s not hard to imagine how important the proper memory management within the browser engine is in such use cases. In fact, WebKit and WPE in particular receive numerous memory-related fixes and improvements every year.
Before making any changes, however, the areas to fix/improve need to be narrowed down first. Like any C++ application, WebKit memory can be profiled using a variety of industry-standard tools. Although such well-known
tools are really useful in the majority of use cases, they have their limits that manifest themselves when applied on production-grade embedded systems in conjunction with long-running web applications.
In such cases, a very useful tool is a debug-only feature of WebKit itself called malloc heap breakdown, which this article describes.
Massif is a heap profiler that comes as part of the Valgrind suite. As its documentation states:
It measures how much heap memory your program uses. This includes both the useful space, and the extra bytes allocated for book-keeping and alignment purposes. It can also measure the size of your program’s stack(s),
although it does not do so by default.
Using Massif with WebKit is very straightforward and boils down to a single command:
The Malloc=1 environment variable set above is necessary to instruct WebKit to enable debug heaps that use the system malloc allocator.
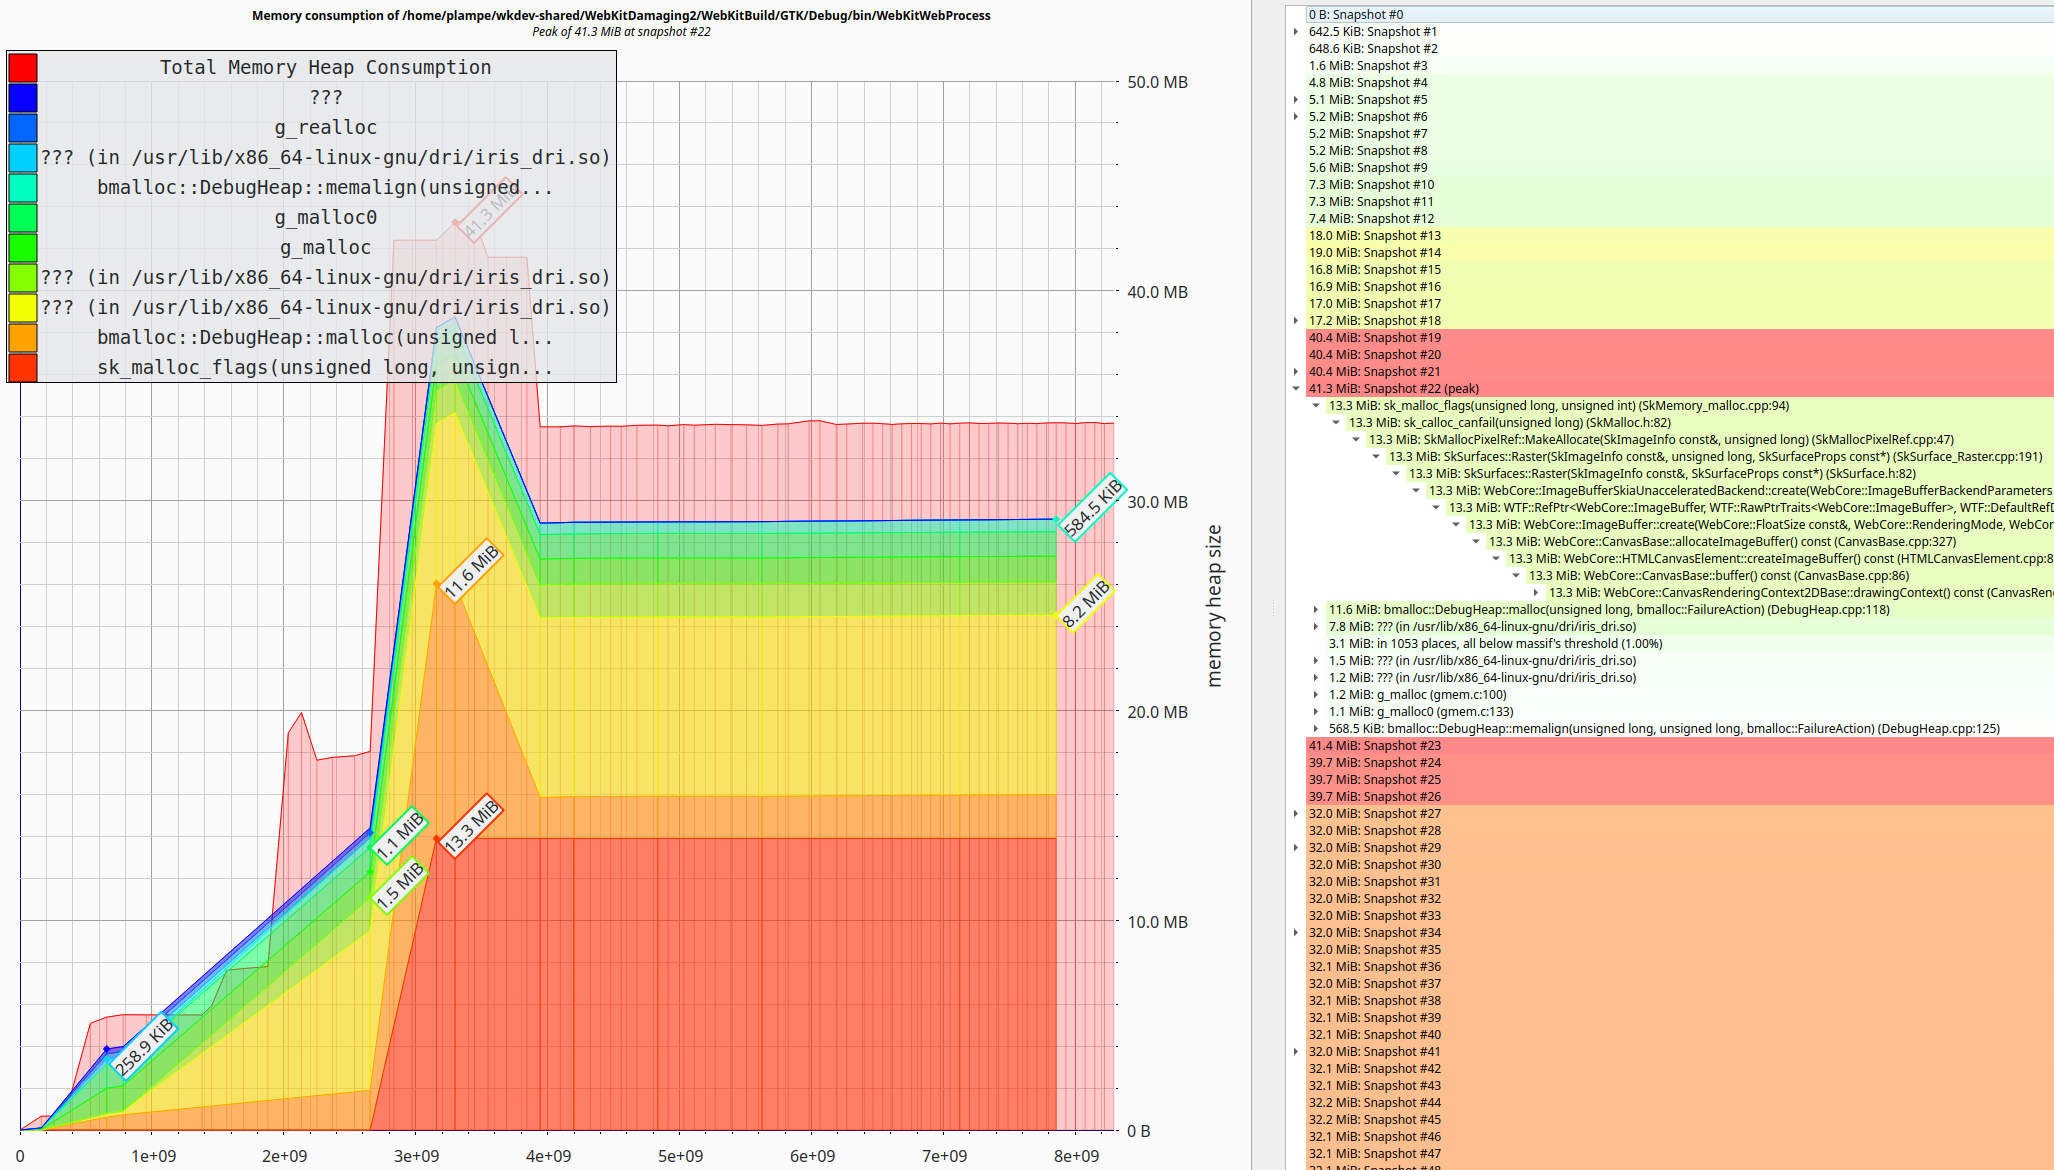
Given some results are generated, the memory usage over time can be visualized using massif-visualizer utility. An example of such a visualization is presented in the image below:
While Massif has been widely adopted and used for many years now, from the very beginning, it suffered from a few significant downsides.
First of all, the way Massif instruments the profiled application introduces significant overhead that may slow down the application up to 2 orders of magnitude. In some cases, such overhead makes it simply unusable.
The other important problem is that Massif is snapshot-based, and hence, the level of detail is not ideal.
Heaptrack is a modern heap profiler developed as part of KDE. The below is its description from the git repository:
Heaptrack traces all memory allocations and annotates these events with stack traces. Dedicated analysis tools then allow you to interpret the heap memory profile to:
find hotspots that need to be optimized to reduce the memory footprint of your application
find memory leaks, i.e. locations that allocate memory which is never deallocated
find allocation hotspots, i.e. code locations that trigger a lot of memory allocation calls
find temporary allocations, which are allocations that are directly followed by their deallocation
At first glance, Heaptrack resembles Massif. However, a closer look at the architecture and features shows that it’s much more than the latter. While it’s fair to say it’s a bit similar, in fact, it is a
significant progression.
Usage of Heaptrack to profile WebKit is also very simple. At the moment of writing, the most suitable way to use it is to attach to a certain running WebKit process using the following command:
heaptrack -p <PID>
while the WebKit needs to be run with system malloc, just like in Massif case:
If profiling of e.g. web content process startup is essential, it’s then recommended also to use WEBKIT2_PAUSE_WEB_PROCESS_ON_LAUNCH=1, which adds 30s delay to the process startup.
When the profiling session is done, the analysis of the recordings is done using:
heaptrack --analyze <RECORDING>
The utility opened with the above, shows various things, such as the memory consumption over time:
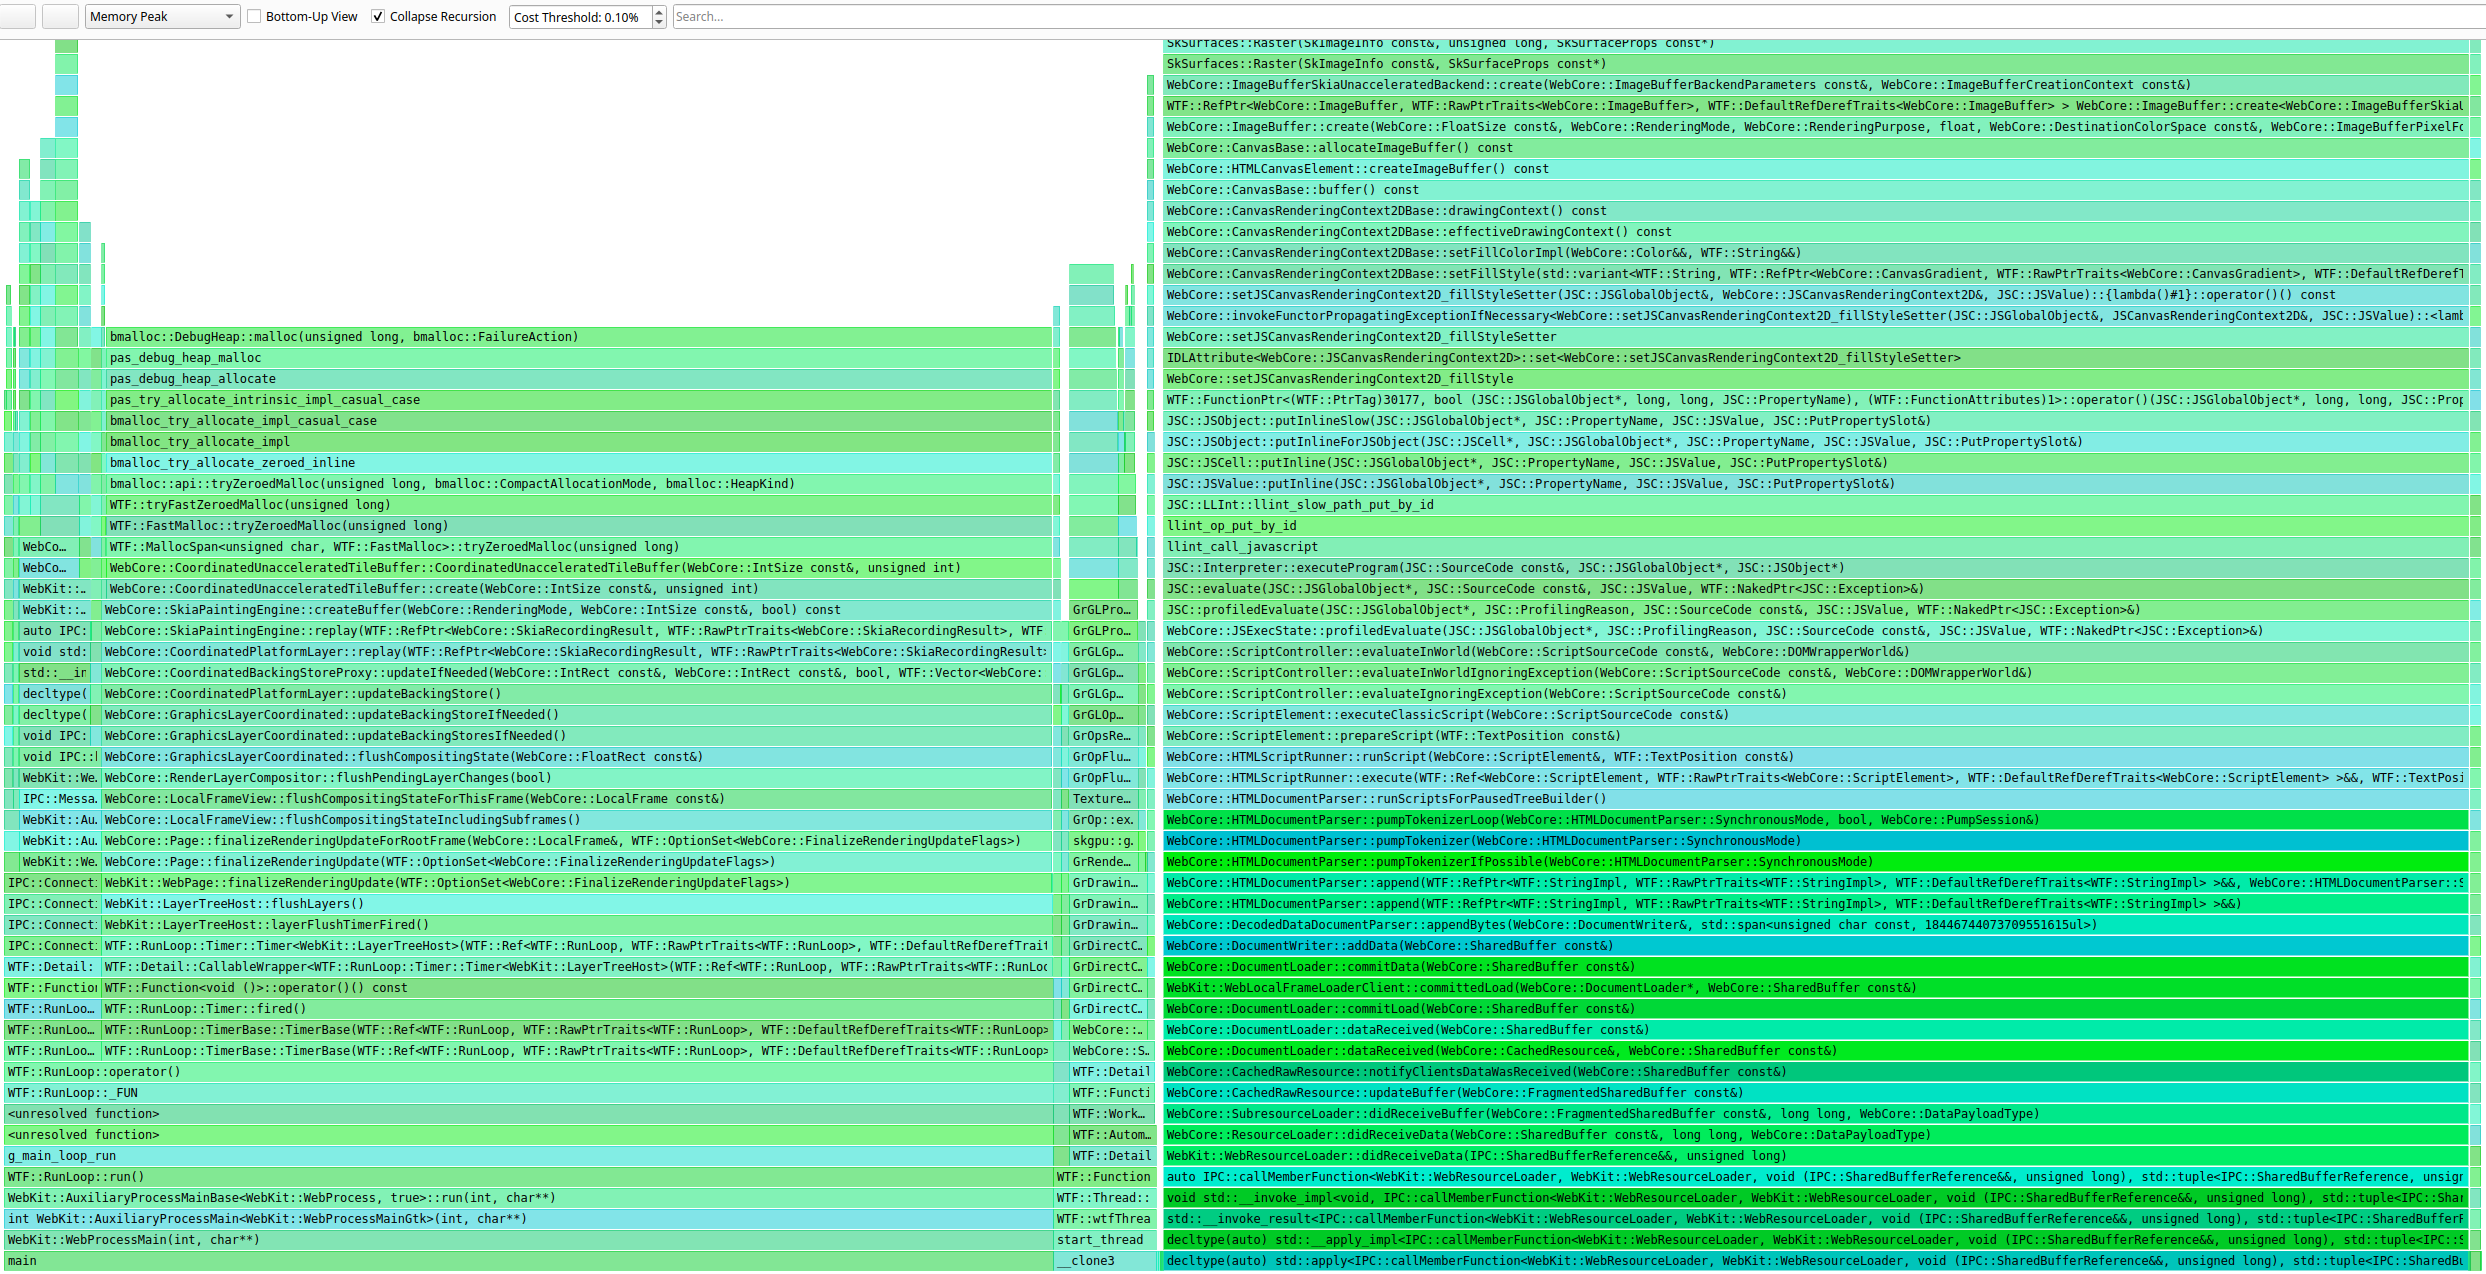
flame graphs of memory allocations with respect to certain functions in the code:
etc.
As Heaptrack records every allocation and deallocation, the data it gathers is very precise and full of details, especially when accompanied by stack traces arranged into flame graphs. Also, as Heaptrack
does instrumentation differently than e.g. Massif, it’s usually much faster in the sense that it slows down the profiled application only up to 1 order of magnitude.
Although the memory profilers such as above are really great for everyday use, their limitations on embedded platforms are:
they significantly slow down the profiled application — especially on low-end devices,
they effectively cannot be run for a longer period of time such as days or weeks, due to memory consumption,
they are not always provided in the images — and hence require additional setup,
they may not be buildable out of the box on certain architectures — thus requiring extra patching.
While the above limitations are not always a problem, usually at least one of them is. What’s worse, usually at least one of the limitations turns into a blocking problem. For example, if the target device is very short on memory,
it may be basically impossible to run anything extra beyond the browser. Another example could be a situation where the application slowdown due to the profiler usage, leads to different application behavior, such as a problem
that originally reproduced 100% of the time, does not reproduce anymore etc.
Profiling the memory of WebKit while addressing the above problems points towards a solution that does not involve any extra tools, i.e. instrumenting WebKit itself. Normally, adding such an instrumentation to the C++ application
means a lot of work. Fortunately, in the case of WebKit, all that work is already done and can be easily enabled by using the Malloc heap breakdown.
In a nutshell, Malloc heap breakdown is a debug-only feature that enables memory allocation tracking within WebKit itself. Since it’s built into WebKit, it’s very lightweight and very easy to build, as it’s just about setting
the ENABLE_MALLOC_HEAP_BREAKDOWN build option. Internally, when the feature is enabled, WebKit switches to using debug heaps that use system malloc along with the malloc zone API
to mark objects of certain classes as belonging to different heap zones and thus allowing one to track the allocation sizes of such zones.
As the malloc zone API is specific to BSD-like OSes, the actual implementations (and usages) in WebKit have to be considered separately for Apple and non-Apple ports.
Malloc heap breakdown was originally designed only with Apple ports in mind, with the reason being twofold:
The malloc zone API is provided virtually by all platforms that Apple ports integrate with.
MacOS platforms provide a great utility called footprint that allows one to inspect per-zone memory statistics for a given process.
Given the above, usage of malloc heap breakdown with Apple ports is very smooth and as simple as building WebKit with the ENABLE_MALLOC_HEAP_BREAKDOWN build option and running on macOS while using the footprint utility:
Footprint is a macOS specific tool that allows the developer to check memory usage across regions.
Since all of the non-Apple WebKit ports are mostly being built and run on non-BSD-like systems, it’s safe to assume the malloc zone API is not offered to such ports by the system itself.
Because of the above, for many years, malloc heap breakdown was only available for Apple ports.
The idea behind the integration for non-Apple ports is to provide a simple WebKit-internal library that provides a fake <malloc/malloc.h> header along with simple implementation that provides malloc_zone_*() function implementations
as proxy calls to malloc(), calloc(), realloc() etc. along with a tracking mechanism that keeps references to memory chunks. Such an approach gathers all the information needed to be reported later on.
At the moment of writing, the above allows 2 methods of reporting the memory usage statistics periodically:
By default, when WebKit is built with ENABLE_MALLOC_HEAP_BREAKDOWN, the heap breakdown is printed to the standard output every few seconds for each process. That can be tweaked by setting WEBKIT_MALLOC_HEAP_BREAKDOWN_LOG_INTERVAL=<SECONDS>
environment variable.
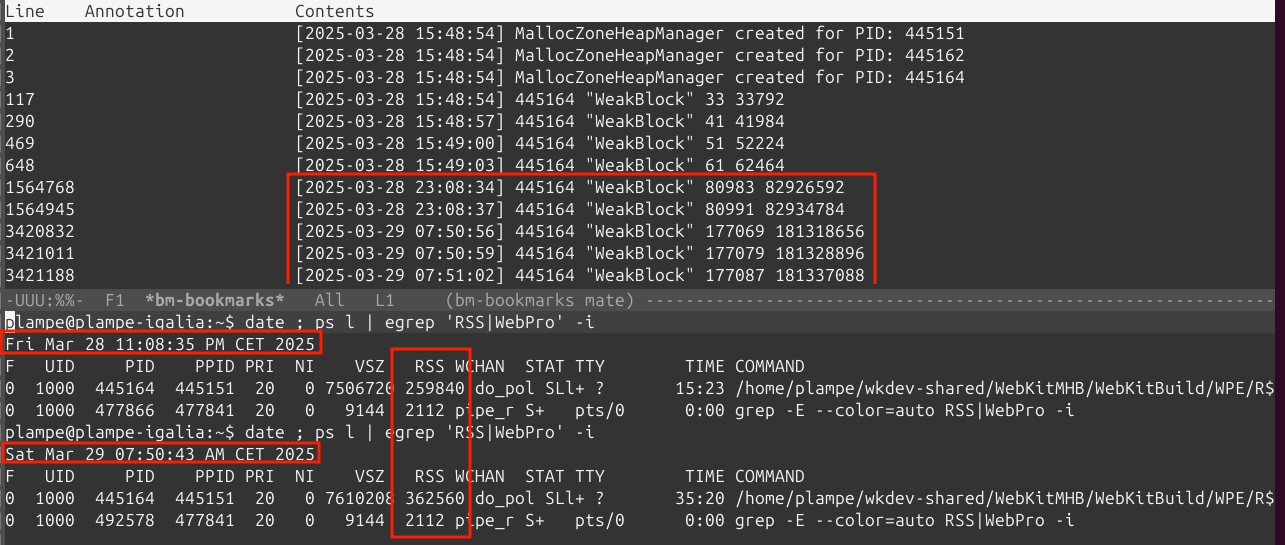
The results have a structure similar to the one below:
Given the allocation statistics per-zone, it’s easy to narrow down the unusual usage patterns manually. The example of a successful investigation is presented in the image below:
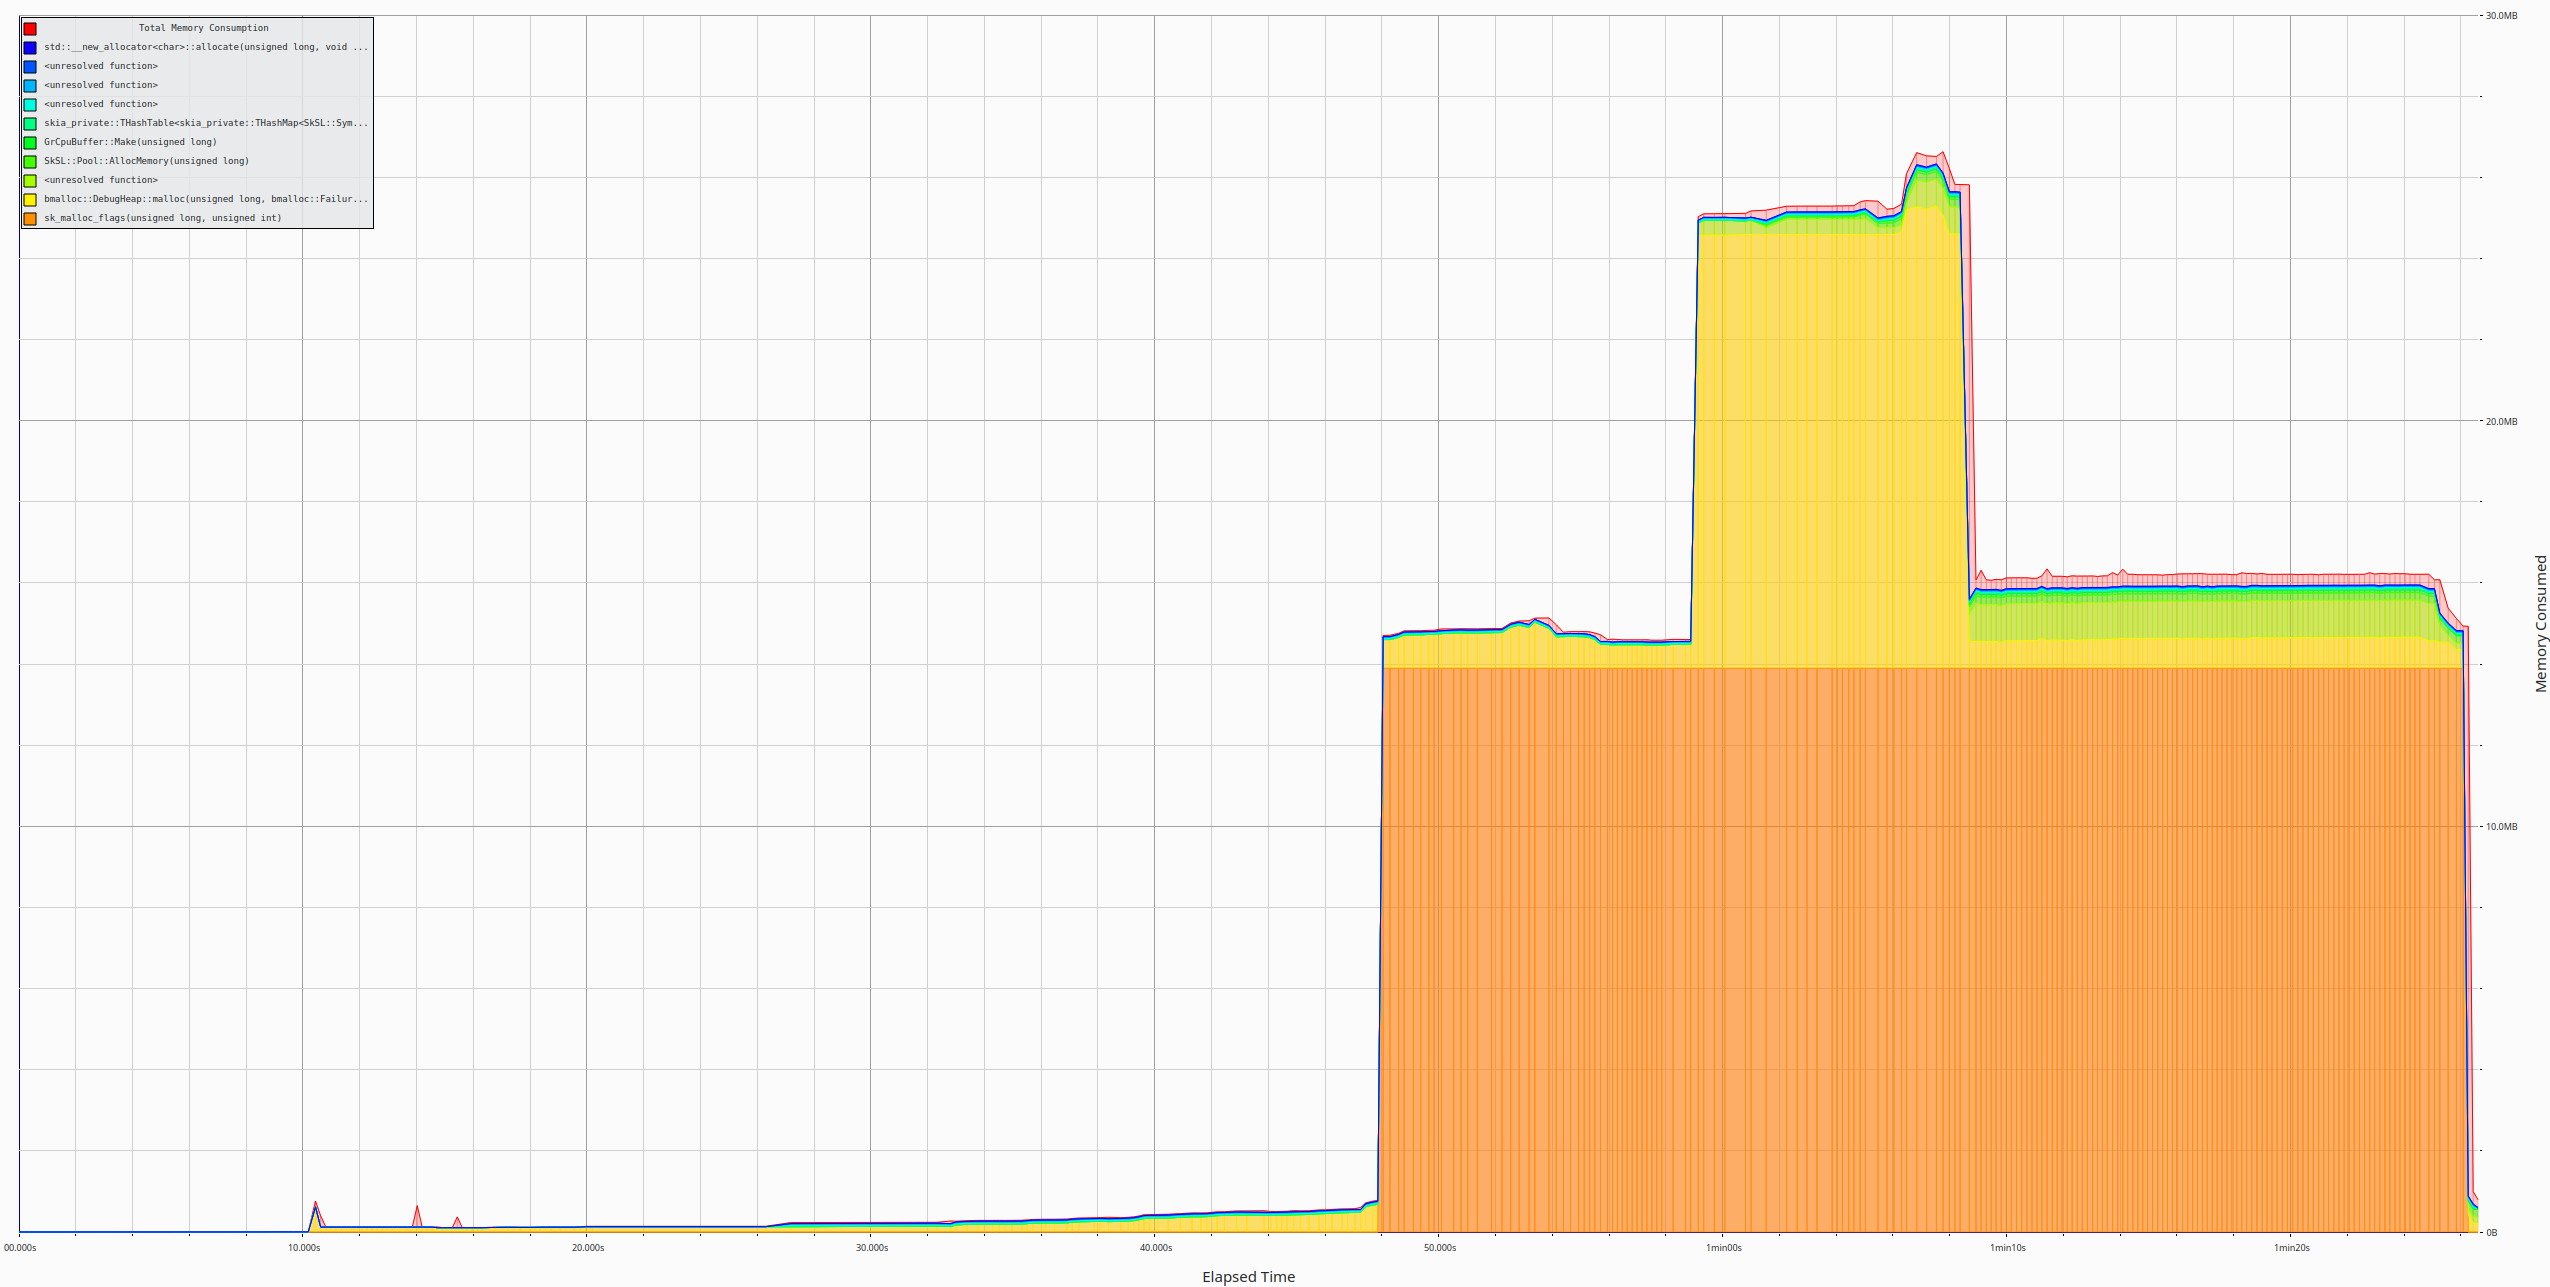
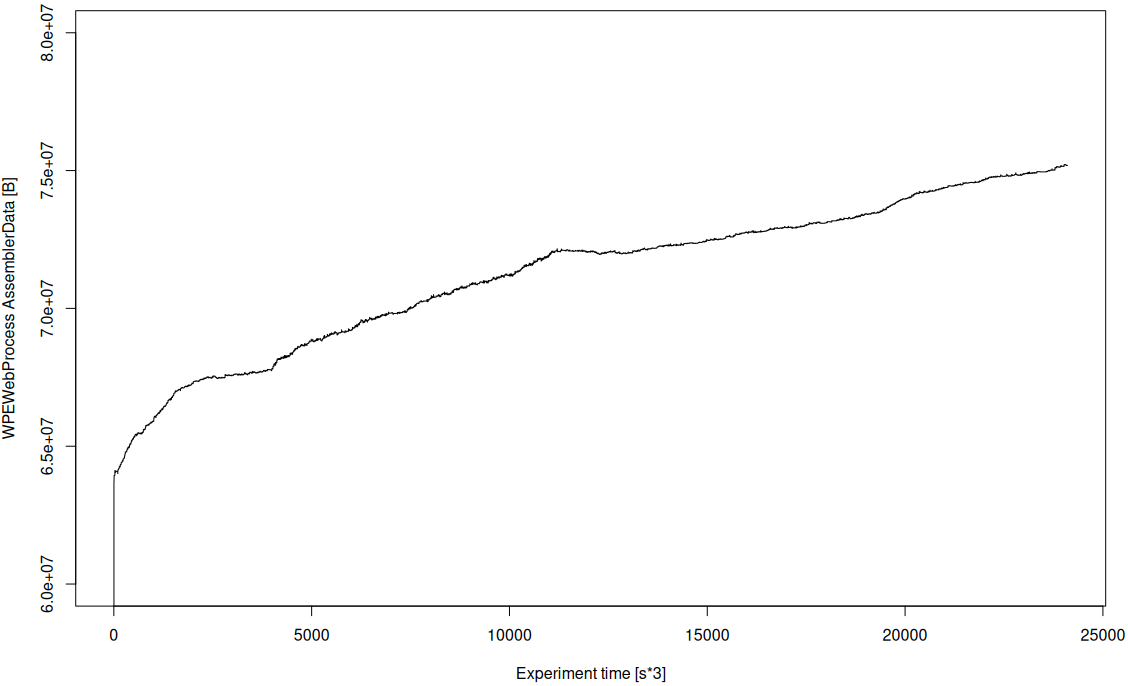
Moreover, the data presented can be processed either manually or using scripts to create memory usage charts that span as long as the application lifetime so e.g. hours (20+ like below), days, or even longer:
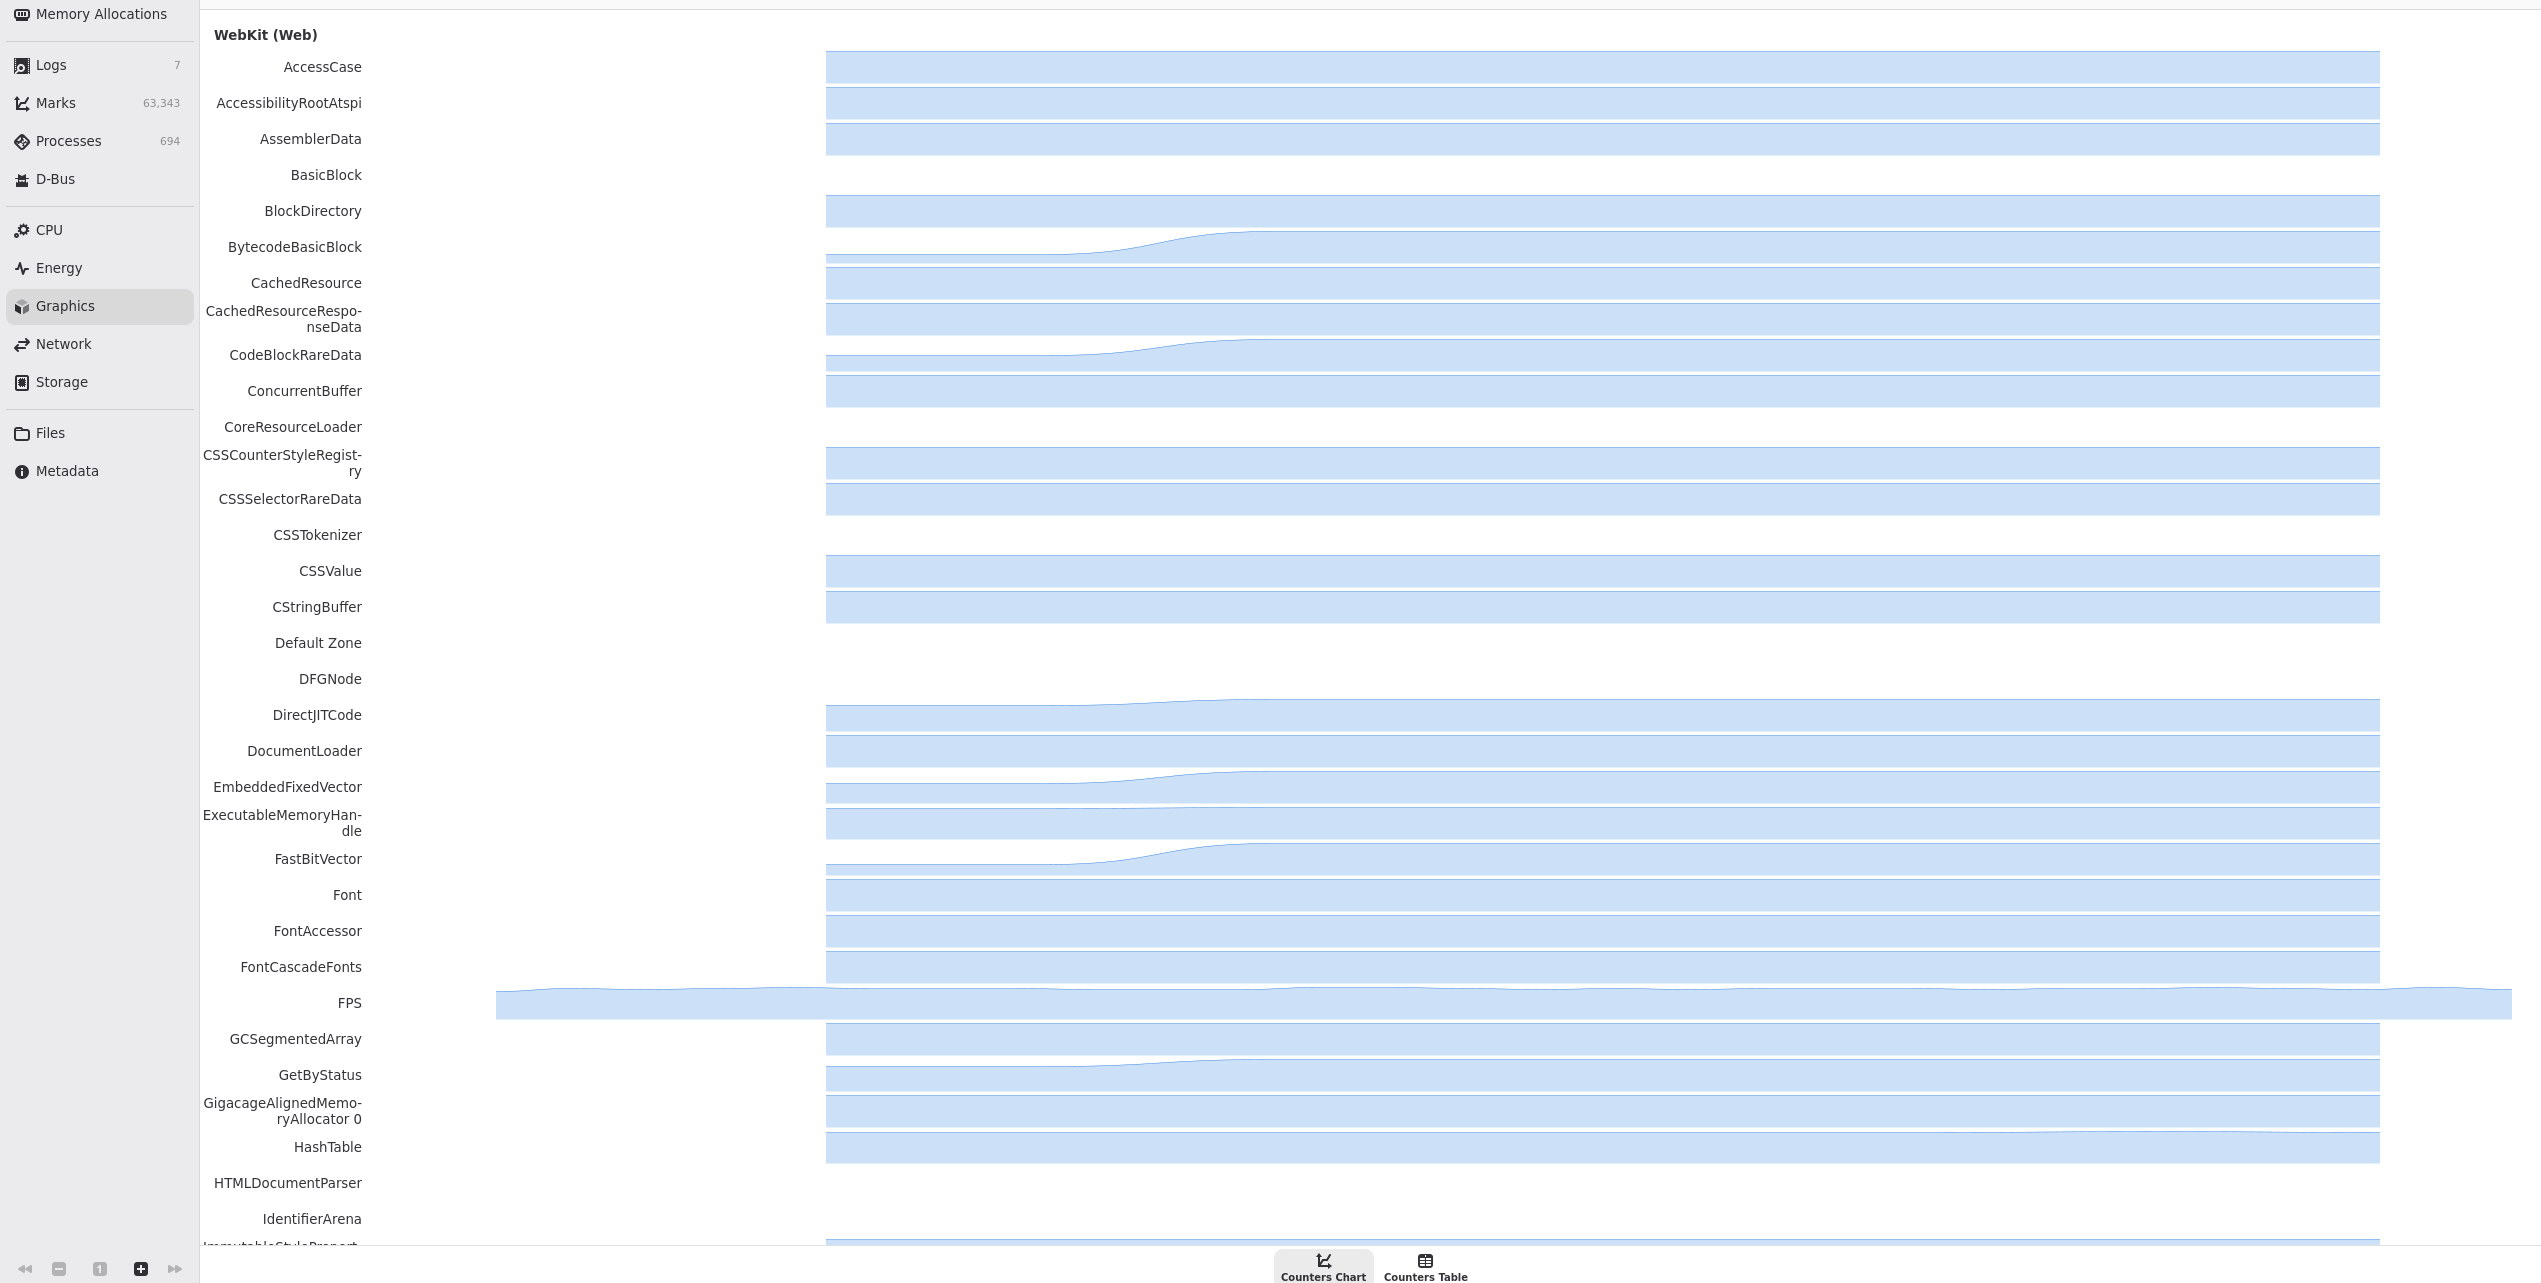
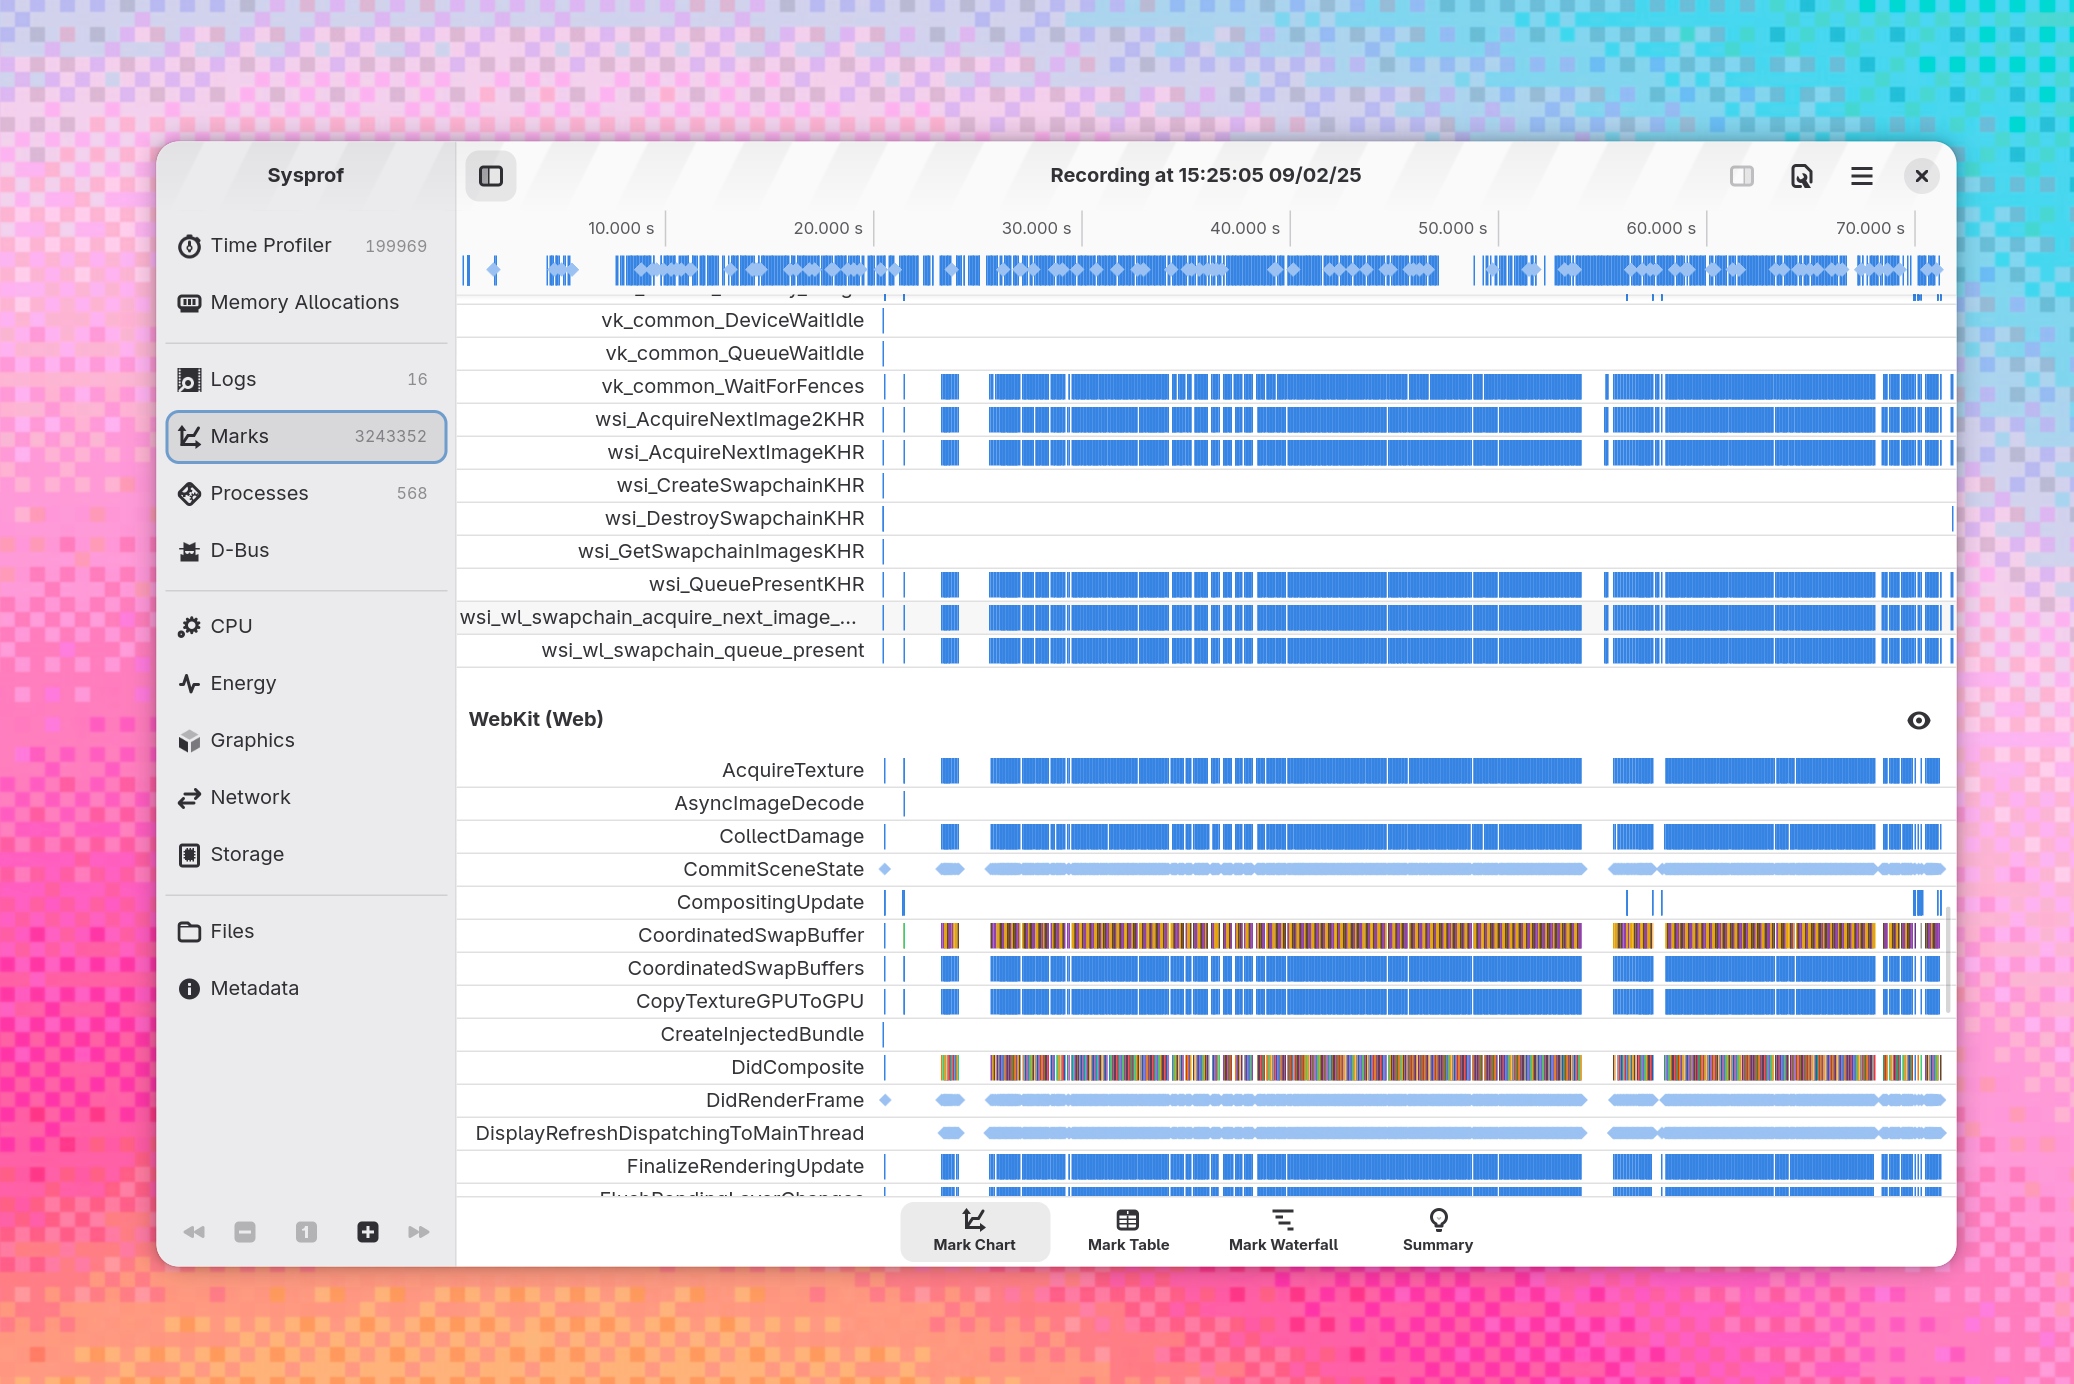
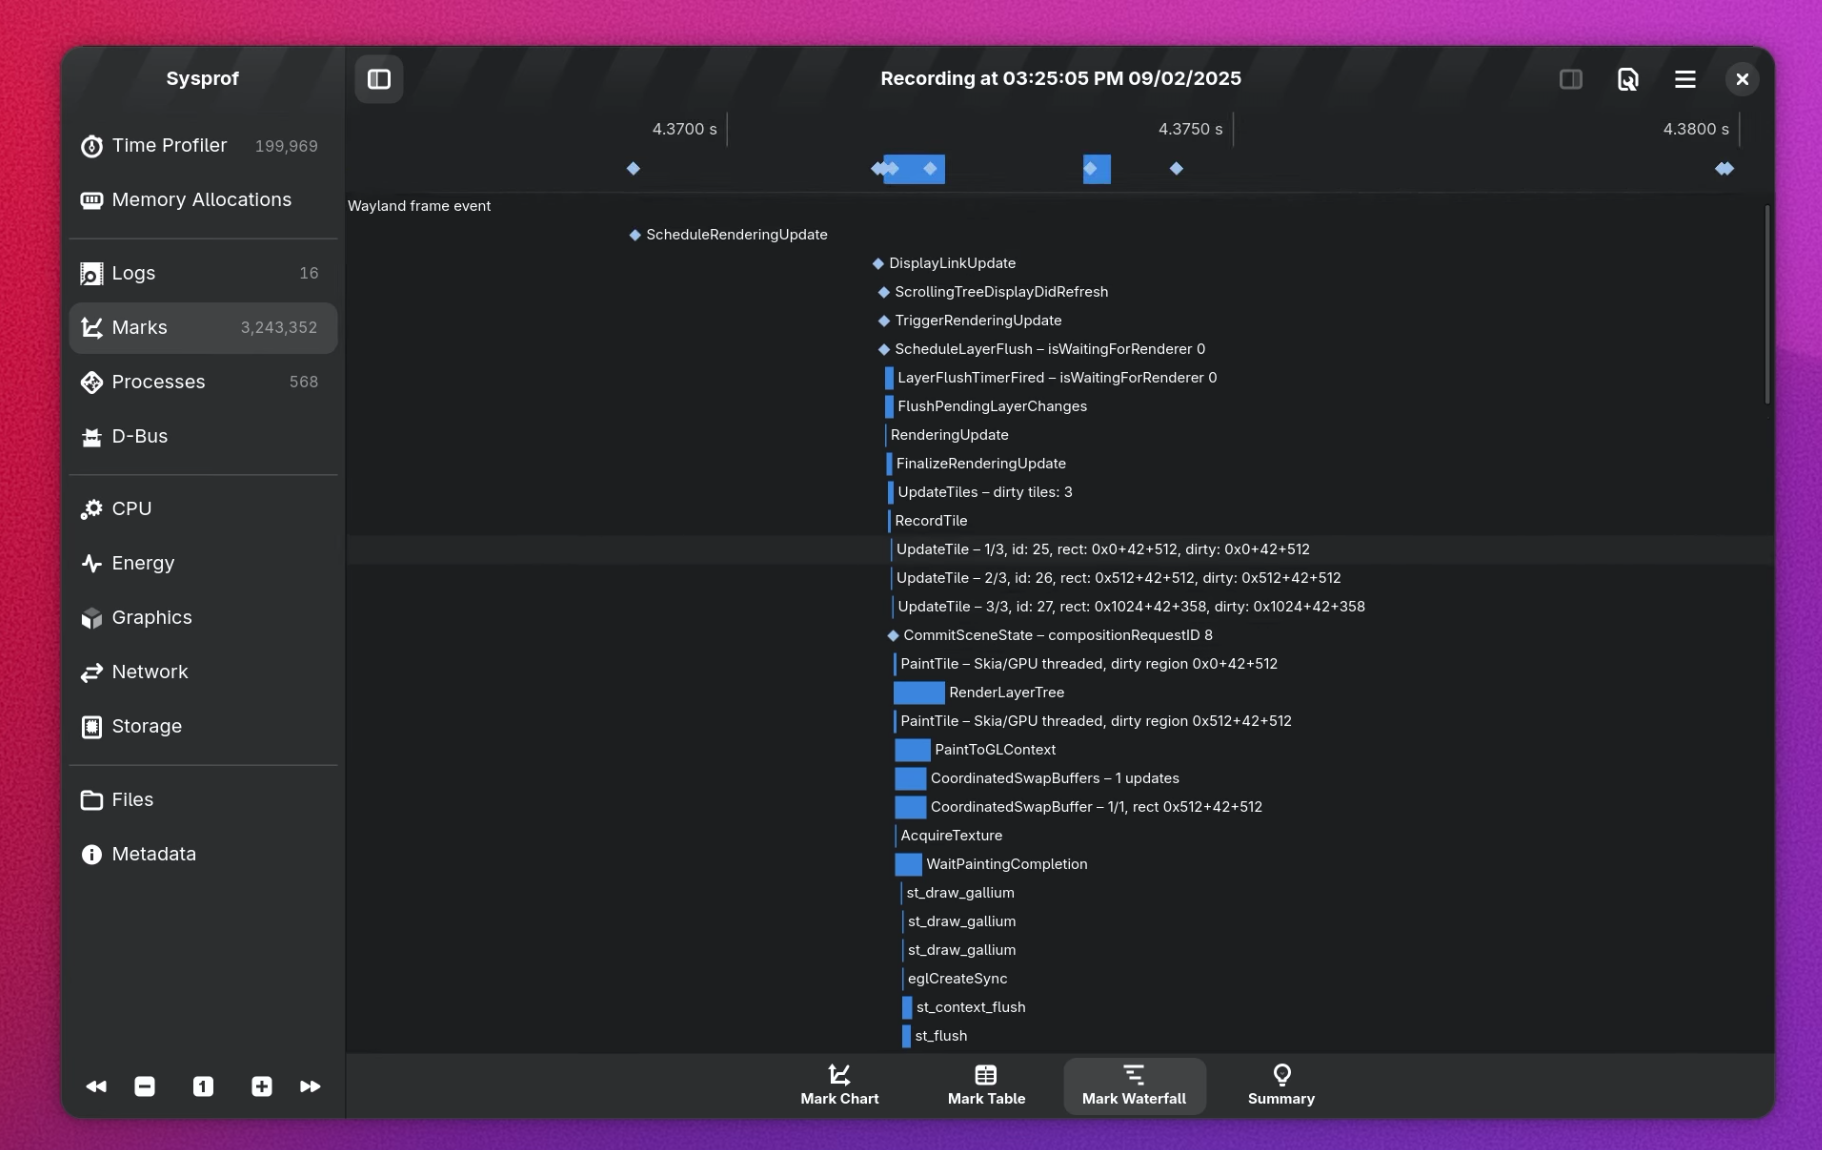
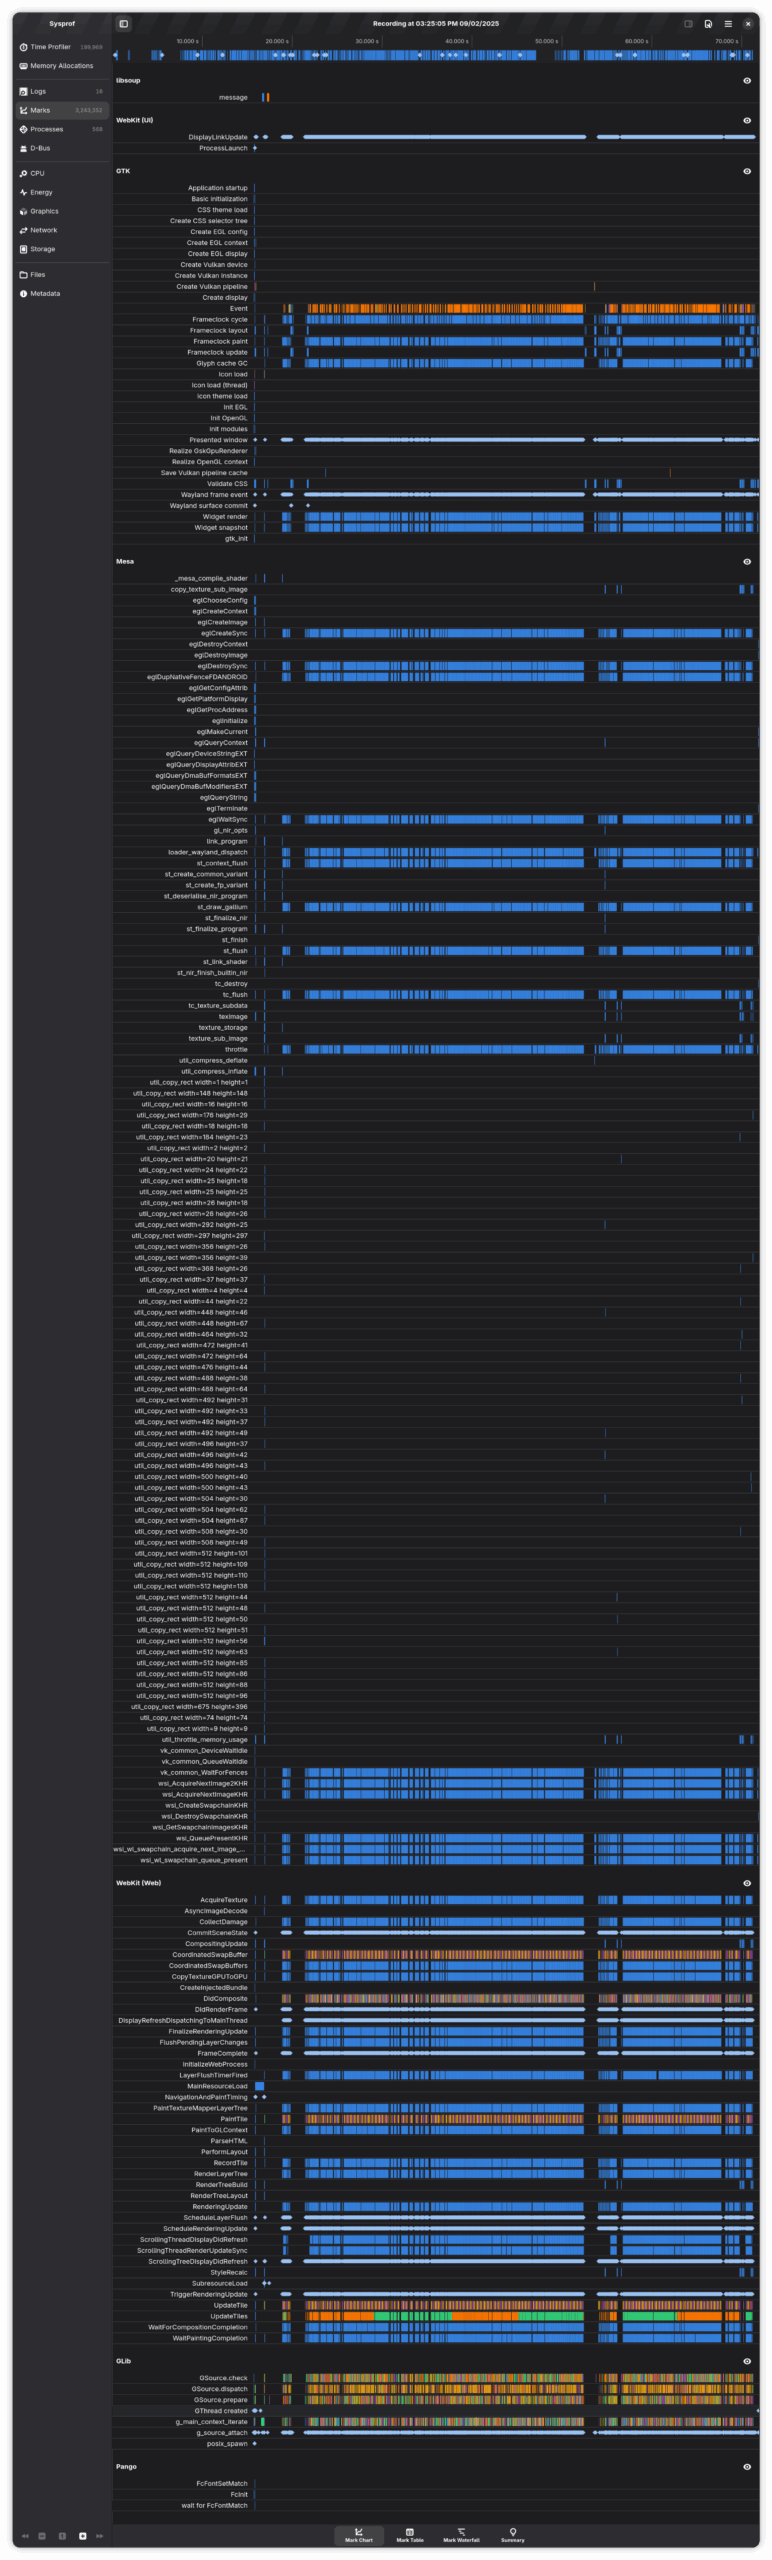
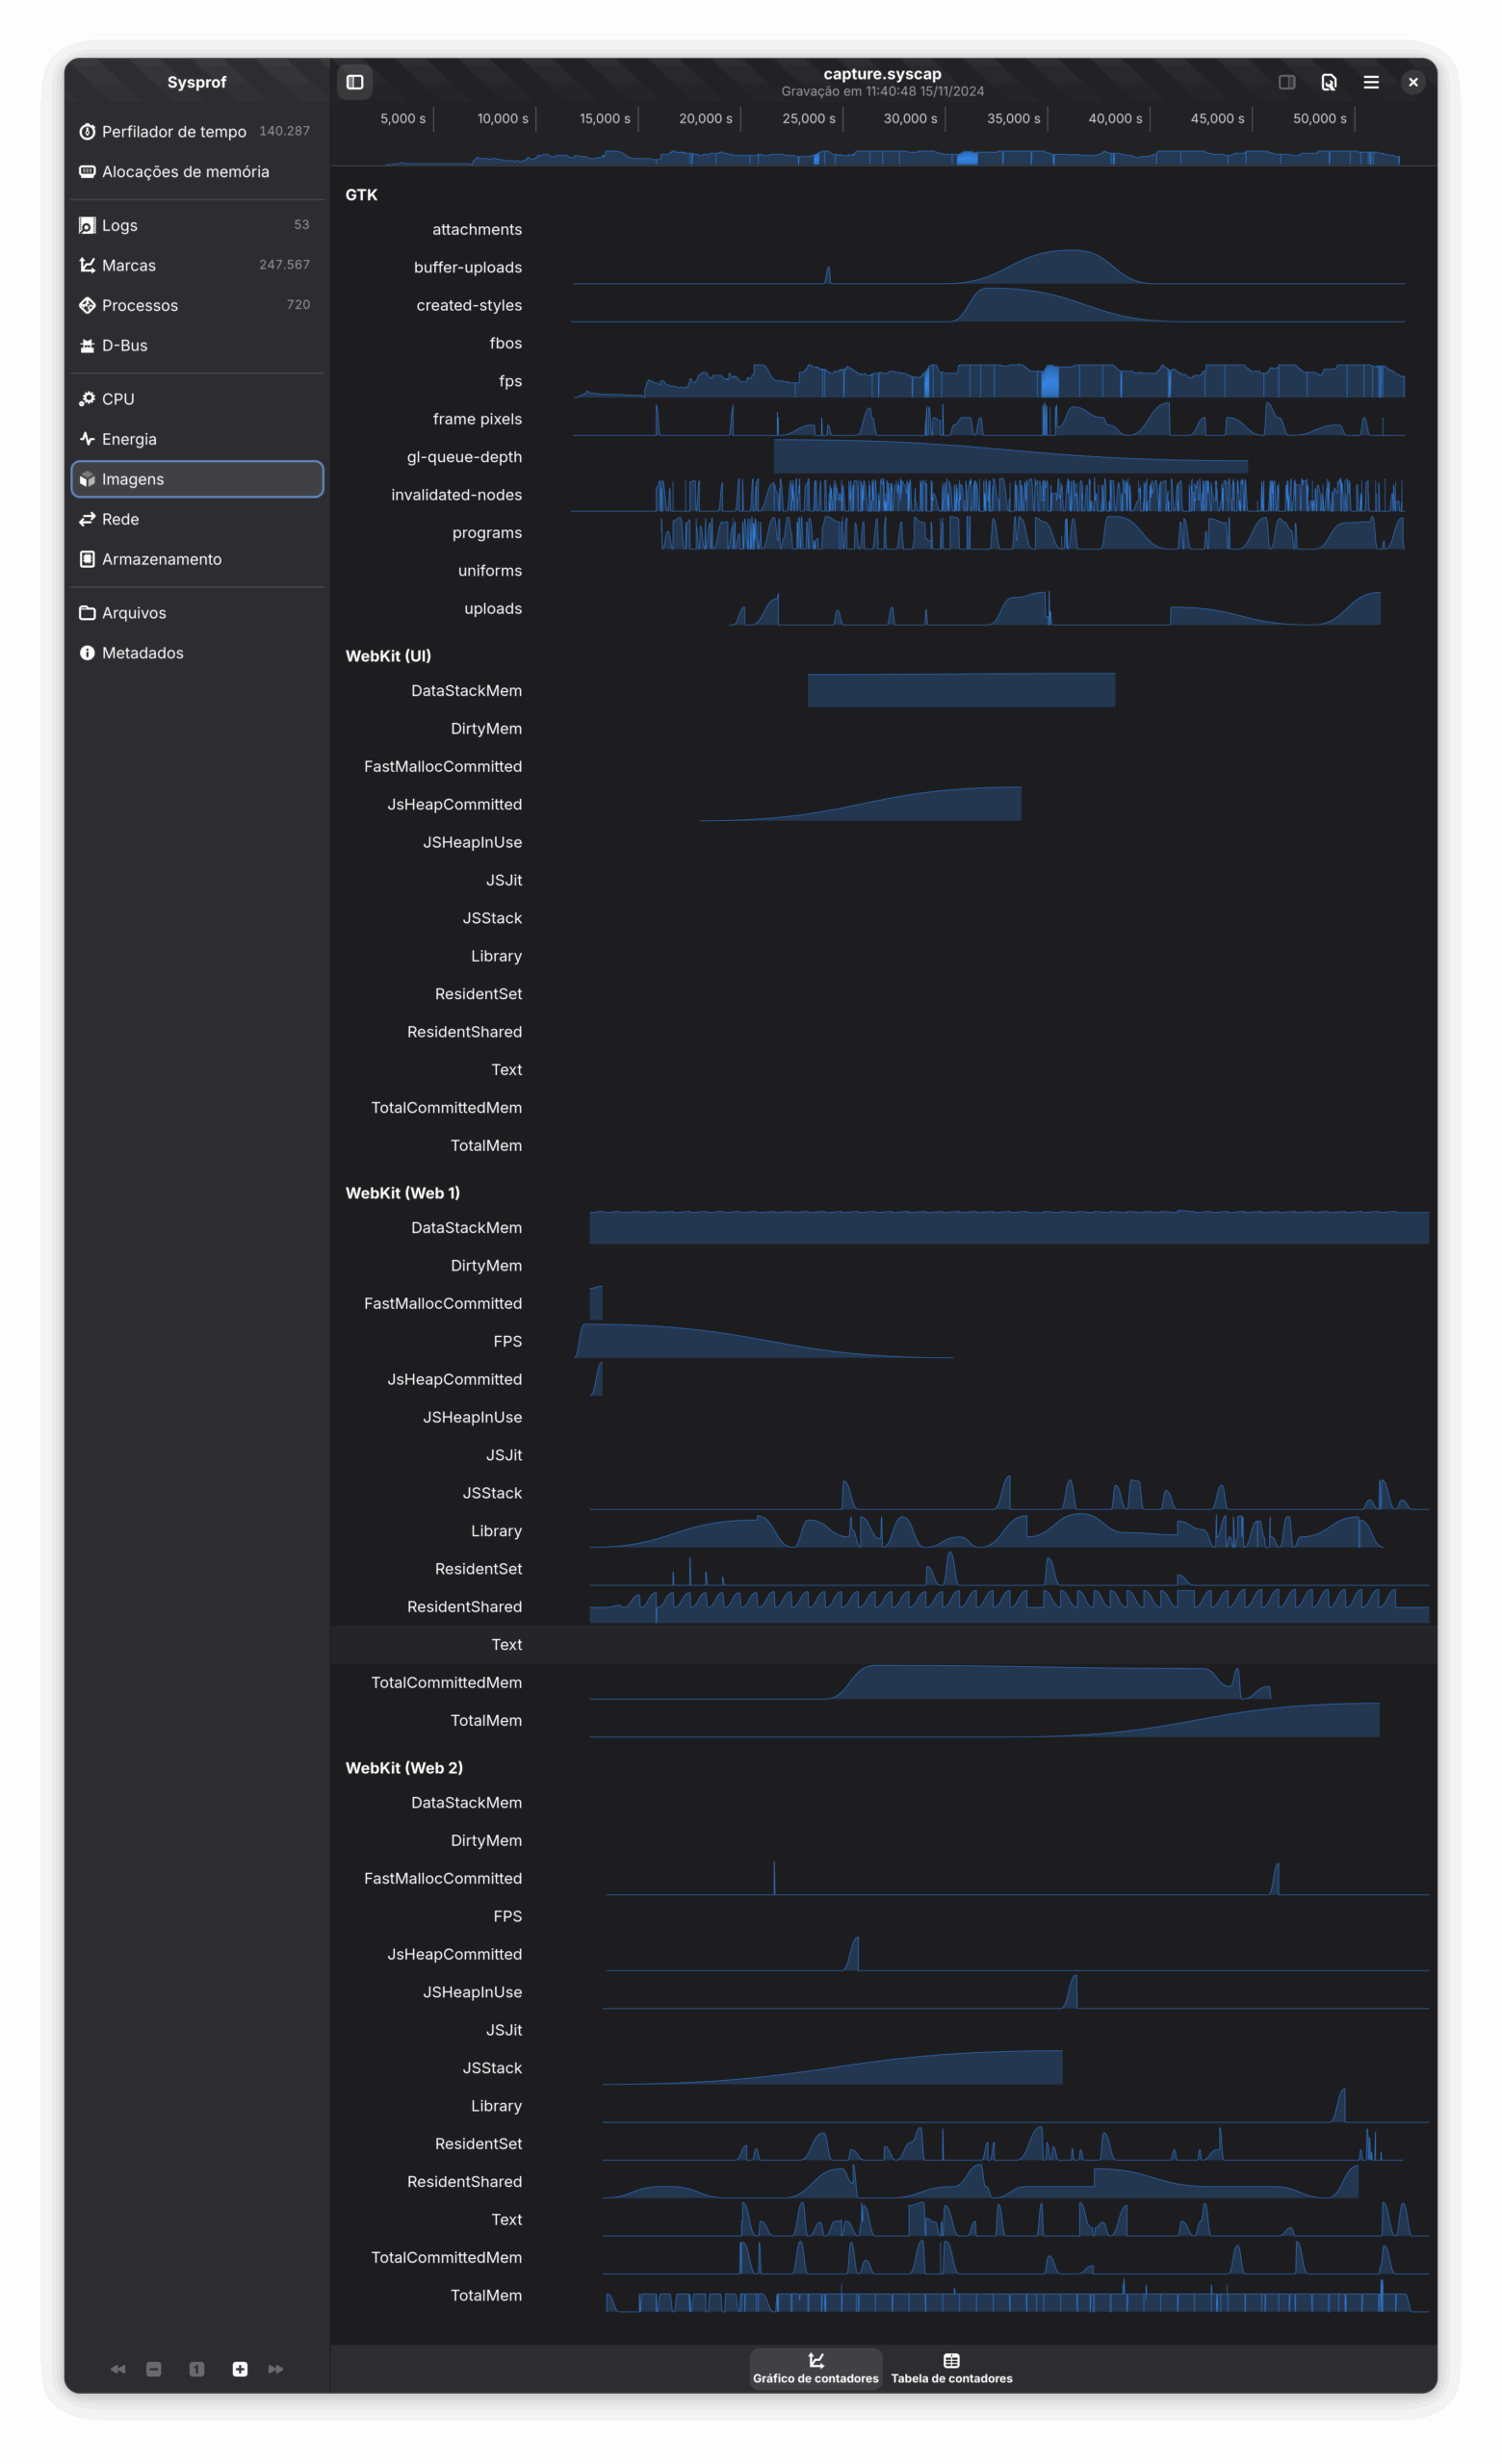
Periodic reporting to sysprof
The other reporting mechanism currently supported is reporting periodically to sysprof as counters. In short, sysprof is a modern system-wide profiling tool
that already integrates with WebKit very well when it comes to non-Apple ports.
The condition for malloc heap breakdown reporting to sysprof is that the WebKit browser needs to be profiled e.g. using:
sysprof-cli -f -- <BROWSER_COMMAND>
and the sysprof has to be in the latest version possible.
With the above, the memory usage statistics can then be inspected using the sysprof utility and look like in the image below:
In the case of sysprof, memory statistics in that case are just a minor addition to other powerful features that were well described in this blog post from Georges.
While malloc heap breakdown is very useful in some use cases — especially on embedded systems — there are a few problems with it.
First of all, compilation with -DENABLE_MALLOC_HEAP_BREAKDOWN=ON is not guarded by any continuous integration bots; therefore, the compilation issues are expected on the latest WebKit main. Fortunately, fixing the problems
is usually straightforward. For a reference on what may be causing compilation problems usually, one should refer to 299555@main, which contains a full variety of fixes.
The second problem is that malloc heap breakdown uses WebKit’s debug heaps, and hence the memory usage patterns may be different just because system malloc is used.
The third, and final problem, is that malloc heap breakdown integration for non-Apple ports introduces some overhead as the allocations need to lock/unlock the mutex, and as statistics are stored in the memory as well.
Although malloc heap breakdown can be considered fairly constrained, in the case of non-Apple ports, it gives some additional possibilities that are worth mentioning.
Because on non-Apple ports, the custom library is used to track allocations (as mentioned at the beginning of the Malloc heap breakdown on non-Apple ports section), it’s very easy
to add more sophisticated tracking/debugging/reporting capabilities. The only file that requires changes in such a case is:
Source/WTF/wtf/malloc_heap_breakdown/main.cpp.
Some examples of custom modifications include:
adding different reporting mechanisms — e.g. writing to a file, or to some other tool,
reporting memory usage with more details — e.g. reporting the per-memory-chunk statistics,
dumping raw memory bytes — e.g. when some allocations are suspicious.
altering memory in-place — e.g. to simulate memory corruption.
While the presented malloc heap breakdown mechanism is a rather poor approximation of what industry standard tools offer, the main benefit of it is that it’s built into WebKit, and that in some rare use-cases (especially on
embedded platforms), it’s the only way to perform any reasonable profiling.
In general, as a rule of thumb, it’s not recommended to use malloc heap breakdown unless all other methods have failed. In that sense, it should be considered a last resort approach. With that in mind, malloc heap breakdown
can be seen as a nice mechanism complementing other tools in the toolbox.
Every day, for both my physical and mental heath, I get away from the computer for a while and for a walk (or two) and listen to some podcast. Sometimes a title suprises me.
This week's Shop Talk (#687) is a good example. It's titled "Ben Frain on Responsive Design" and to be honest, I wondered if I'd get anything out of it. Responsive Design... Haven't we been doing that for... Well, a really long time? Sure. And they talk about that.
But what interested me most was more of a sidequest: There were some "spicy" but thoughtful takes. There was some discussion about which things were actually valuable. And how valuable? In what ways? There was discussion about whether some of "the juice was worth the squeeze?"
Was @scope really worth it? Is <picture> as valuable as we thought it would be? What about Container Queries? Or @layer? Or are View Transitions too confusing? Or are you actually using :has as much as you imagined? Honestly, I love hearing some of this discussion from developers because the question isn't "does it have value?" because the answer is "yes, of course". The questions are more like "At what cost?" or "Did we have give something else up in order to get that?" or "Do we sometimes try to land a 'quick win' and then come back and really solve the problem, and sort of make it more confusing?" They are great questions - and reasonable people can disagree!
Projects like Interop are us trying to do our best to balance lots of inputs and help us make good choices. Choosing to prioritize something from a list is, inherently, not choosing something else. This year my friend Jake Archibald put together this prioritization survey tool which lets you try to participate in what is effectively like a step of our process: Order them as you'd personally asign priority if you were in charge. It's hard, and this process is over-simplified in the sense that you are not constrained by the sorts of things real engineering teams are. Maybe you sort 10 items to the top, but half of them are very expensive and also involve the same expertise. Maybe that means that realistically we can only pick 2 of those 10, and then we can also pick several more items outside your "top 10".
There are debatable signals. Only a few people will pick OffscreenCanvas but most people deal with canvas via only a few primary libraries - so it doesn't take much to lift performance of lots of sites. MathML isn't going to make you a lot of money - but actually sharing mathematical text is super important. Or, maybe something seems only mildly valuable, but someone is actually willing to pay for the work to get done. That changes the calculus about what kind of standards effort it will require from engine stewards themselves.
And, at the end of the day, in a way, all of us are speculating about perceived value. The truth is that we often just can't know. Sometimes, only time will tell. Sometimes a feature lands flat, only to take off years later. Sometimes the features we were really excited about turn out to be not so great.
Once upon a time I imagined a future where the web community did a lot more of this kind of discussion, a lot earlier. I imagined that we should be trying to give people answers in terms of polyfills and origin trials and including their actual feedback with time to use it before we went forward.
We have done it more than we did, but not nearly as much as I'd hoped. I still kind of want us to get there. It means standards might go a little slower sometimes, I guess - but you could get solutions and input faster and have more opportunity for course corrections.
Anyway, fun episode. I'd love to hear your critiques too - send them!
Update on what happened in WebKit in the week from October 13 to October 20.
This week was calmer than previous week but we still had some
meaningful updates. We had a Selenium update, improvements to
how tile sizes are calculated, and a new Igalian in the list
of WebKit committer!
Cross-Port 🐱
Selenium's relative locators are now supported after commit 301445@main. Before, finding elements with locate_with(By.TAG_NAME, "input").above({By.ID: "password"}) could lead to "Unsupported locator strategy" errors.
Graphics 🖼️
A patch landed to compute the layers tile size, using a different strategy depending on whether GPU rendering is enabled, which improved the performance for both GPU and CPU rendering modes.
Update on what happened in WebKit in the week from October 6 to October 13.
Another week with many updates in Temporal, the automated testing
infrastructure is now running WebXR API tests; and WebKitGTK gets
a fix for the janky Inspector resize while it drops support for
libsoup 2. Last but not least, there are fresh releases of both the
WPE and GTK ports including a security fix.
Cross-Port 🐱
Multimedia 🎥
GStreamer-based multimedia support for WebKit, including (but not limited to) playback, capture, WebAudio, WebCodecs, and WebRTC.
The built-in JavaScript/ECMAScript engine for WebKit, also known as JSC or SquirrelFish.
JavaScriptCore's implementation of
Temporal
received a flurry of improvements:
Implemented the toString,
toJSON, and toLocaleString methods for the PlainMonthDay type.
Brought the implementation of the round method on TemporalDuration
objects up to spec. This is
the last in the series of patches that refactor TemporalDuration methods to
use the InternalDuration type, enabling mathematically precise computations
on time durations.
Implemented basic support for
the PlainMonthDay type, without most methods yet.
Brought the implementations of the since and until functions on Temporal
PlainDate objects up to
spec, improving the precision
of computations.
WebKitGTK 🖥️
WebKitGTK will no longer support
using libsoup 2 for networking starting with version 2.52.0, due in March 2026.
An article in the
website has
more details and migrations tips for application developers.
Fixedthe jittering
bug of the docked Web Inspector window width and
height while dragging the resizer.
Releases 📦️
WebKitGTK
2.50.1 and
WPE WebKit 2.50.1 have
been released. These include a number of small fixes, improved text rendering
performance, and a fix for audio playback on Instagram.
A security advisory, WSA-2025-0007
(GTK,
WPE), covers one security
issue fixed in these releases. As usual, we recommend users and distributors to
keep their WPE WebKit and WebKitGTK packages updated.
Infrastructure 🏗️
Updated the API test runner to
run monado-service without standard input using XRT_NO_STDIN=TRUE, which
allows the WPE and GTK bots to start validating the WebXR API.
Submitted a change that allows
relaxing the DMA-BUF requirement when creating an OpenGL display in the
OpenXRCoordinator, so that bots can run API tests in headless environments that
don't have that extension.
Announcing a polyfill for the TC39 decimal proposal
I’m happy to announce that the decimal proposal—a proposed extension of JavaScript to support decimal numbers—is now available as an NPM package called proposal-decimal!
(Actually, it has been available for some time, made available not long after we decided to pursue IEEE 754 Decimal128 as a data model for the decimal proposal rather than some alternatives. The old package was—and still is—available under a different name—decimal128—but I’ll be sunsetting that package in favor of the new one announced here. If you’ve been using decimal128, you can continue to use it, but you’ll probably want to switch to proposal-decimal.)
To use proposal-decimal in your project, install the NPM package. If you’re looking to use this code in Node.js or other JS engines that support ESM, you'll want to import the code like this:
import { Decimal128 } from 'proposal-decimal';
const x = new Decimal128("0.1");
// etc.
For use in a browser, the file dist/Decimal128.mjs contains the Decimal128 class and all its internal dependencies in a single file. Use it like this:
The intention of this polyfill is to track the spec text for the decimal proposal. I cannot recommend this package for production use just yet, but it is usable and I’d love to hear any experience reports you may have. We’re aiming to be as faithful as possible to the spec, so we don’t aim to be blazingly fast. That said, please do report any wild deviations in performance compared to other decimal libraries for JS as an issue. Any crashes or incorrect results should likewise be reported as an issue.
I‘m on macOS and use Homebrew extensively. My simple go-to approach to finding new software is to do brew search lean. This revealed lean as well as surface elan. Running brew info lean showed me that that package (at the time I write this) installs Lean 3. But I know, out-of-band, that Lean 4 is what I want to work with. Running brew info elan looked better, but the output reminds me that (1) the information is for the elan-init package, not the elancask, and (2) elan-init conflicts with both the elan and the aforementioned lean. Yikes! This strikes me as a potential problem for the community, because I think Lean 3, though it still works, is presumably not where new Lean development should be taking place. Perhaps the Homebrew formula for Lean should be updated called lean3, and a new lean4 package should be made available. I‘m not sure. The situation seems less than ideal, but in short, I have been successful with the elan-init package.
After installing elan-init, you‘ll have the elan tool available in your shell. elan is the tool used for maintaining different versions of Lean, similar to nvm in the Node.js world or pyenv.
Setting up a blank package
When I did the Lean 4 tutorial at BOB, I worked entirely within VS Code and created a new standalone package using some in-editor functionality. At the command line, I use lake init to manually create a new Lean package. At first, I made the mistake of running this command, assuming it would create a new directory for me and set up any configuration and boilerplate code there. I was surprised to find, instead, that lake init sets things up in the current directory, in addition to creating a subdirectory and populating it. Using lake --help, I read about the lake new command, which does what I had in mind. So I might suggest using lake new rather than lake init.
What‘s in the new directory? Doing tree foobar reveals
-- This module serves as the root of the `Foobar` library.-- Import modules here that should be built as part of the library.import«Foobar».Basic
It looks like there‘s a little module structure here, and a reference to the identifier hello, defined in Foobar/Basic.lean and made available via Foobar.lean. I’m not going to touch lakefile.lean for now; as a newbie, it looks scary enough that I think I’ll just stick to things like Basic.lean.
There‘s also an automatically created .git there, not shown in the directory output above.
Now what?
Now that you‘ve got Lean 4 installed and set up a package, you‘re ready to dive in to one of the official tutorials. The one I‘m working through is David‘s Functional Programming in Lean. There‘s all sorts of additional things to learn, such as all the different lake commands. Enjoy!
The decimals around us: Cataloging support for decimal numbers
Decimals numbers are a data type that aims to exactly represent decimal numbers. Some programmers may not know, or fully realize, that, in most programming languages, the numbers that you enter look like decimal numbers but internally are represented as binary—that is, base-2—floating-point numbers. Things that are totally simple for us, such as 0.1, simply cannot be represented exactly in binary. The decimal data type—whatever its stripe or flavor—aims to remedy this by giving us a way of representing and working with decimal numbers, not binary approximations thereof. (Wikipedia has more.)
To help with my work on adding decimals to JavaScript, I've gone through a list of popular programming languages, taken from the 2022 StackOverflow developer survey. What follows is a brief summary of where these languages stand regarding decimals. The intention is to keep things simple. The purpose is:
If a language does have decimals, say so;
If a language does not have decimals, but at least one third-party library exists, mention it and link to it. If a discussion is underway to add decimals to the language, link to that discussion.
There is no intention to filter out an language in particular; I'm just working with a slice of languages found in in the StackOverflow list linked to earlier. If a language does not have decimals, there may well be multiple third-part decimal libraries. I'm not aware of all libraries, so if I have linked to a minor library and neglect to link to a more high-profile one, please let me know. More importantly, if I have misrepresented the basic fact of whether decimals exists at all in a language, send mail.
C
C does not have decimals. But they're working on it! The C23 standard (as in, 2023) standard proposes to add new fixed bit-width data types (32, 64, and 128) for these numbers.
C#
C# has decimals in its underlying .NET subsystem. (For the same reason, decimals also exist in Visual Basic.)
C++
C++ does not have decimals. But—like C—they're working on it!
Dart
Dart does not have decimals. But a third-party library exists.
Go
Go does not have decimals, but a third-party library exists.
JavaScript does not have decimals. We're working on it!
Kotlin
Kotlin does not have decimals. But, in a way, it does: since Kotlin is running on the JVM, one can get decimals by using Java's built-in support.
Ruby has decimals. Despite that, there is some third-party work to improve the built-in support.
Rust
Rust does not have decimals, but a crate exists.
SQL
SQL has decimals (it is the DECIMAL data type). (Here is the documentation for, e.g., PostgreSQL, and here is the documentation for MySQL.)
TypeScript does not have decimals. However, if decimals get added to JavaScript (see above), TypeScript will probably inherit decimals, eventually.
Native support for decimal numbers in the Python programming language
Native support for decimal numbers in the Python programming language
As part of the project of exploring how decimal numbers could be added to JavaScript, I'd like to take a step back and look at how other languages support decimals (or not). Many languages do support decimal numbers. It may be useful to understand the range of options out there for supporting them. For instance, what kind of data model do they use? What are the limits (if there are any)? Does the langauge include any special syntax for decimal?
Here, I'd like to briefly summarize what Python has done.
Does Python support decimals?
Python supports decimal arithmetic. The functionality is part of the standard library. Decimals aren't available out-of-the-box, in the sense that all Python programs, regardless of what they import, can start working with decimals. There is no decimal literal syntax in the language. That said, all one needs to do is import * from decimal and you're ready to rock.
Decimals have been part of the Python standard library for a long time: they were added in version 2.4, in November 2001. Python does have a process for proposing extensions to the language, called PEP (Python Extension Proposal). Extensive discussions on the official mailing lists took place. Python decimals were formalized in PEP 327.
The decimal library provides access to some of the internals of decimal arithmetic, called the context. In the context, one can specify, for instance, the number of decimal digits that should be available when operations are carried out. One can also forbid mixing of decimal values with primitive built-in types, such as integers and (binary) floating-point numbers.
In general, the Python implementation aims to be an implementation of the General Decimal Arithmetic Specification. In particular, using this data model, it is possible to distinguish the digit strings 1.2 and 1.20, considered as decimal values, as mathematically equal but nonetheless distinct values.
Aside: How does this compare with Decimal128, one of the contender data models for decimals in JavaScript? Since Python's decimal feature is an implementation of the General Decimal Arithmetic Specification, it works with a sort of generalized IEEE 754 Decimal. No bit width is specified, so Python decimals are not literally the same as Decimal128. However, one can suitably parameterize Python's decimal to get something essentially equivalent to Decimal128:
specify the minimum and maximum exponent to -6144 and 6143, respectively (the defaults are -999999 and 999999, respectively)
specify the precision to 34 (default is 28)
API for Python decimals
Here are the supported mathematical functions:
natural exponentiation and log (e^x, ln(x))
log base 10
a^b (two-argument exponentiation, though the exponent needs to be an integer)
step up/down (1.451 → 1.450, 1.452)
square root
fused multiply-and-add (a*b + c)
As mentioned above, the data model for Python decimals allows for subnormal decimals, but one can always normalize a value (remove the trailing zeros). (This isn't exactly a mathematical function, since distinct members of a cohort are mathematically equal.)
In Python, when importing decimals, some of the basic arithmetic operators get overloaded. Thus, +, *, and **, etc., produce correct decimal results when given decimal arguments. (There is some possibility for something roughly similar in JavaScript, but that discussion has been paused.)
Trigonometric functions are not provided. (These functions belong to the optional part of the IEEE 754 specification.)
Binary floats can let us down! When close enough isn't enough
If you've played Monopoly, you'll know abuot the Bank Error in Your Favor card in the Community Chest. Remember this?
A bank error in your favor? Sweet! But what if the bank makes an error in its favor? Surely that's just as possible, right?
I'm here to tell you that if you're doing everyday financial calculations—nothing fancy, but involving money that you care about—then you might need to know that using binary floating point numbers, then something might be going wrong. Let's see how binary floating-point numbers might yield bank errors in your favor—or the bank's.
In a wonderful paper on decimal floating-point numbers, Mike Colishaw gives an example.
Here's how you can reproduce that in JavaScript:
12
(1.05*0.7).toPrecision(2);#0.73
Some programmers might not be aware of this, but many are. By pointing this out I'm not trying to be a smartypants who knows something you don't. For me, this example illustrates just how common this sort of error might be.
For programmers who are aware of the issue, one typical approache to dealing with it is this: Never work with sub-units of a currency. (Some currencies don't have this issue. If that's you and your problem domain, you can kick back and be glad that you don't need to engage in the following sorts of headaches.) For instance, when working with US dollars of euros, this approach mandates that one never works with euros and cents, but only with cents. In this setting, dollars exist only as an abstraction on top of cents. As far as possible, calculations never use floats. But if a floating-point number threatens to come up, some form of rounding is used.
Another aproach for a programmer is to delegate financial calculations to an external system, such as a relational database, that natively supports proper decimal calculations. One difficulty is that even if one delegates these calculations to an external system, if one lets a floating-point value flow int your program, even a value that can be trusted, it may become tainted just by being imported into a language that doesn't properly support decimals. If, for instance, the result of a calculation done in, say, Postgres, is exactly 0.1, and that flows into your JavaScript program as a number, it's possible that you'll be dealing with a contaminated value. For instance:
This example, admittedly, requires quite a lot of decimals (19!) before the ugly reality of the situation rears its head. The reality is that 0.1 does not, and cannot, have an exact representation in binary. The earlier example with the cost of a phone call is there to raise your awareness of the possibility that one doesn't need to go 19 decimal places before one starts to see some weirdness showing up.
There are all sorts of examples of this. It's exceedingly rare for a decimal number to have an exact representation in binary. Of the numbers 0.1, 0.2, …, 0.9, only 0.5 can be exactly represented in binary.
Next time you look at a bank statement, or a bill where some tax is calculated, I invite you to ask how that was calculated. Are they using decimals, or floats? Is it correct?
I'm working on the decimal proposal for TC39 to try to work what it might be like to add proper decimal numbers to JavaScript. There are a few very interesting degrees of freedom in the design space (such as the precise datatype to be used to represent these kinds of number), but I'm optimistic that a reasonable path forward exists, that consensus between JS programmers and JS engine implementors can be found, and eventually implemented. If you're interested in these issues, check out the README in the proposal and get in touch!
(This is my first NPM package. I made it in TypeScript; it’s my first go at the language.)
What?
Decimal128 is an IEEE standard for floating-point decimal numbers. These numbers aren’t the binary floating-point numbers that you know and love (?), but decimal numbers. You know, the kind we learn about before we’re even ten years old. In the binary world, things like 0.1 + 0.2 aren’t exactly* equal to 0.3, and calculations like 0.7 * 1.05 work out to exactly0.735. These kinds of numbers are what we use when doing all sorts of everyday calculations, especially those having to do with money.
Decimal128 encodes decimal numbers into 128 bits. It is a fixed-width encoding, unlike arbitrary-precision numbers, which, of course, require an arbitrary amount of space. The encoding can represent of numbers with up to 34 significant digits and an exponent of –6143 to 6144. That is a truly vast amount of space if one keeps the intended use cases involving human-readable and -writable numbers (read: money) in mind.
Why?
I’m working on extending the JavaScript language with decimal numbers (proposal-decimal). One of the design decisions that has to be made there is whether to implement arbitrary-precision decimal numbers or to implement some kind of approximation thereof, with Decimal128 being the main contender. As far as I could tell, there was no implementation of Decimal128 in JavaScript, so I made one.
The intention isn’t to support the full Decimal128 standard, nor should one expect to achieve the performance that, say, a C/C++ library would give you in userland JavaScript. (To say nothing of having machine-native decimal instructions, which is truly exotic.) The intention is to give JavaScript developers something that genuinely strives to approximate Decimal128 for JS programs.
In particular, the hope is that this library offers the JS community a chance to get a feel for what Decimal128 might be like.
How to use
Just do
$ npm install decimal128
and start using the provided Decimal128 class.
Issues?
If you find any bugs or would like to request a feature, just open an issue and I’ll get on it.
A comprehensive, authoritative FAQ on decimal arithmetic
Mike Cowlishaw’s FAQ on decimal arithmetic
If you’re interested in decimal arithmetic in computers, you’ve got to check out Mike Cowlishaw’s FAQ on the subject. There’s a ton of insight to be had there. If you like the kind of writing that makes you feel smarter as you read it, this one is worth your time.
For context: Cowlishaw is the editor of the 2008 edition of the IEEE 754 standard, updating the 1985 and 1987 standards. The words thus carry a lot of authority, and it would be quite unwise to ignore Mike in these matters.
If you prefer similar information in article form, take a look at Mike’s Decimal Floating-Point: Algorism for Computers. (Note the delightful use of algorism. Yes, it’s a word.)
The FAQ focused mainly on floating-point decimal arithmetic, not arbitrary-precision decimal arithmetic (which is what one might immediately think of when the one hears decimal arithmetic). Arbitrary-precision decimal arithmetic is whole other ball of wax. In that setting, we’re talking about sequences of decimal digits whose length cannot be specified in advance. Proposals such as decimal128 are about a fixed bit width—128 bits—which allows for a lot of precision, but not arbitrary precision.
One crucial insight I take away from Mike’s FAQ—a real misunderstanding on my part which is a bit embarrassing to admit—is that decimal128 is not just a 128-bit version of the same old binary floating-point arithmetic we all know about (and might find broken). It’s not as though adding more bits meets the demands of those who want high-precision arithmetic. No! Although decimal128 is a fixed-width encoding (128 bits), the underlying encoding is decimal, not binary. That is, decimal128 isn’t just binary floating-point with extra juice. Just adding bits won’t unbreak busted floating-point arithmetic; some new ideas are needed. And decimal128 is a way forward. It is a new (well, relatively new) format that addresses all sorts of use cases that motivate decimal arithmetic, including needs in business, finance, accounting, and anything that uses human decimal numbers. What probably led to my confusion is thinking that the adjective floating-point, regardless of what it modifies, must be some kind of variation of binary floating-point arithmetic.
QuickJS is a neat JavaScript engine by FabriceBellard. It’s fast and small (version 2021-03-27 clocks in at 759 Kb). It includes support for arbitrary-precision decimals, even though the TC39 decimal proposal is (at the time of writing) still at Stage 2. You can install it using the tool of your choice; I was able to install it using Homebrew for macOS (the formula is called quickjs) and FreeBSD and OpenBSD. It can also be installed using esvu. (It doesn’t seem to be available as a package on Ubuntu.)
To get started with arbitrary precision decimals, you need to fire up QuickJS with the bignum flag:
(The m is the proposed suffix for literal high-precision decimal numbers that proposal-decimal is supposed to give us.) Notice how we nicely unbreak JavaScript decimal arithmetic, without having to load a library.
The final API in the official TC39 Decimal proposal still has not been worked out. Indeed, a core question there remains outstanding at the time of writing: what kind of numeric precision should be supported? (The two main contenders are arbitrary precision and the other being 128-bit IEEE 754 (high, but not *arbitrary*, precision). QuickJS does arbitrary precision.) Nonetheless, QuickJS provides a BigDecimal function:
Moreover, you can do basic arithmetic with decimals: addition, subtraction, multiplication, division, modulo, square roots, and rounding. Everything is done with infinite precision (no loss of information). If you know, in advance, what precision is needed, you can tweak the arithmetical operations by passing in an options argument. Here’s an example of adding two big decimal numbers:
qjs > var a = 0.12345678910111213141516171819m;
undefined
qjs > var b = 0.19181716151413121110987654321m;
undefined
qjs > BigDecimal.add(a,b)
0.3152739506152433425250382614m
qjs > BigDecimal.add(a,b, { "roundingMode": "up", "maximumFractionDigits": 10 })
0.3152739507m
Notes on AI for Mathematics and Theoretical Computer Science
In April 2025 I had the pleasure to attend an intense week-long workshop at the Simons Institute for the Theory of Computing entitled AI for Mathematics and Theoretical Computer Science. The event was organized jointly with the Simons Laufer Mathematical Sciences Institute (SLMath, for short). It was an intense time (five fully-packed days!) for learning a lot about cutting-edge ideas in this intersection of formal mathematics (primarily in Lean), AI, and powerful techniques for solving mathematical problems, such as SAT solvers and decision procedures (e.g., the Walnut system). Videos of the talks (but not of the training sessions) have been made available.
Every day, several dozen people were in attendance. Judging from the array of unclaimed badges (easily another several dozen), quite a lot more had signed up for the event, but didn't come for one reason or another. It was inspiring to be in the room with so many people involved in these ideas. The training sessions in the afternoon had a great vibe, since so many people we learning and working together simultaneously.
It was great to connect with a number of people, of all stripes. Most of the presenters and attendees were coming from academia, with a minority, such as myself, coming from industry.
The organization was fantastic. We had talks in the morning and training in the afternoon. The final talk in the morning, before lunch, was an introduction to the afternoon training. The training topics were:
The links above point to the tutorial git repos for following along at home.
In the open discussion on the final afternoon, I raised my hand and outed myself as someone coming to the workshop from an industry perspective. Although I had already met a few people in industry prior to Friday, I was able to meet even more by raising my hand and inviting fellow practioners to discuss things. This led to meeting a few more people.
The talks were fascinating; the selection of speakers and topics was excellent. Go ahead and take a look at the list of videos, pick out one or two of interest, grab a beverage of your choice, and enjoy.
The inspiration for doing Leaning In! came from the tutorial at BOBKonf 2024 by Joachim Breitner and David Christiansen. The tutorial room was full; in fact, it was overfull and not everyone who wanted to attend could attend. I’d kept my eye on Lean from its earliest days but lost the thread for a long time. The image I had of Lean came from its version 1 and 2 days, when the project was still closely aligned the aims of homotopy type theory. I didn’t know about Lean version 3. So when I opened my eyes and woke up, I was in the current era of Lean (version 4), with a great language, humongous standard library, and pretty sensibile tooling. I was on board right away. As an organizer of Racketfest, I had some experience putting together (small) conferences, so I thought I’d give it a go with Lean.
I announced the conference a few months ago, so there wasn’t all that much time to find speakers and plan. Still, we had 33 people in the room. When I first started planning the workshop, I thought there’d only be 10-12 people. This was my first time organizing a Lean workshop of any sort, so my initial expectations were very modest. I booked a fairly small room at Spielfeld for that. After some encouragement from Joachim, who politely suggested that 10-12 might be a bit too small, I requested a somewhat larger room, for up to 20 people. But as registrations kept coming in, I needed to renegotiate with Spielfeld. Ultimately, they put us in their largest room (a more appropriately sized room exists but had already been booked). The room we were in was somewhat too big, but I’m glad we had the space.
Lean is a delightful mix of program verification and mathematics formalization. That was reflected in the program. We had three talks,
that, I’d say, were definitely more in the computer science camp. With Lean, it’s not so clear at times. Lukas’s talk was motivated by some applications coming from computer science but the topic makes sense on its own and could have been taken up by a mathematician. The opening talk, Recursive definitions, by Joachim Breitner, was about the internals of Lean itself, so I think it doesn’t count as a talk on formalizing mathematics. But it sort of was, in the sense that it was about the logic in the Lean kernel. It was computer science-y, but it wasn’t really about using Lean, but more about better understanding how Lean works under the hood.
It is clear that mathematics formalization in Lean is very much ready for research level mathematics. The mathematics library is very well developed, and Lean is fast enough, with good enough tooling, to enable mathematicians to do serious stuff. We are light years past noodling about the Peano axioms or How do I formalize a group?. I have a guy feeling that we may be approaching a point in the near future wher Lean might become a common way of doing mathematics.
What didn’t go so well
The part of the event that probably didn’t go quite as I had planned was the Proof Clinic in the afternoon. The intention of the proof clinic was to take advantage of the fact that many of us had come to Berlin to meet face-to-face, and there were several experts in the room. Let’s work together! If there’s anything you’re stuck on, let’s talk about it and make some progress, today. Think of it as a sort of micro-unconference (just one hour long) within a workshop.
That sounds good, but I didn’t prepare the attendees well enough. I only started adding topics to the list of potential discussion items in the morning, and I was the only one adding them. Privately, I had a few discussion items in my back pocket, but they were intended just to get the conversation going. My idea was that once we prime the pump, we’ll have all sorts of things to talk about.
That’s not quite what happened. We did, ultimately, discuss a few interesting things but it took a while for us to warm up. Also, doing the proof clinic as a single large group might not have been the best idea. Perhaps we should have split up into groups and tried to work together that way.
I also learned that several attendees don’t use Zulip, so my assumption that Zulip is the one and only way for people to communicate about Lean wasn’t quite right. I could have done better communication with attendees in advance to make sure that we coordinate discussion in Zulip, instead of simply assuming that, of course, everyone is there.
The future
Will there be another edition of Leaning In!
Yes, I think so. It's a lot of work to organize a conference (and there's always more to do, even when you know that there's a lot!). But the community benefits are clear. Stay tuned!
Here's how to unbreak floating-point math in JavaScript
Because computers are limited, they work in a finite range of numbers, namely, those that can be represented straightforwardly as fixed-length (usually 32 or 64) sequences of bits. If you’ve only got 32 or 64 bits, it’s clear that there are only so many numbers you can represent, whether we’re talking about integers or decimals. For integers, it’s clear that there’s a way to exactly represent mathematical integers (within the finite domain permitted by 32 or 64 bits). For decimals, we have to deal with the limits imposed by having only a fixed number of bits: most decimal numbers cannot be exactly represented. This leads to headaches in all sorts of contexts where decimals arise, such as finance, science, engineering, and machine learning.
It has to do with our use of base 10 and the computer’s use of base 2. Math strikes again! Exactness of decimal numbers isn’t an abstruse, edge case-y problem that some mathematicians thought up to poke fun at programmers engineers who aren’t blessed to work in an infinite domain. Consider a simple example. Fire up your favorite JavaScript engine and evaluate this:
1 + 2 === 3
You should get true. Duh. But take that example and work it with decimals:
0.1 + 0.2 === 0.3
You’ll get false.
How can that be? Is floating-point math broken in JavaScript? Short answer: yes, it is. But if it’s any consolation, it’s not just JavaScript that’s broken in this regard. You’ll get the same result in all sorts of other languages. This isn’t wat. This is the unavoidable burden we programmers bear when dealing with decimal numbers on machines with limited precision.
Maybe you’re thinking OK, but if that’s right, how in the world do decimal numbers get handled at all? Think of all the financial applications out there that must be doing the wrong thing countless times a day. You’re quite right! One way of getting around oddities like the one above is by always rounding. So instead of working with, say, this is by handling decimal numbers as strings (sequences of digits). You would then define operations such as addition, multiplication, and equality by doing elementary school math, digit by digit (or, rather, character by character).
So what to do?
Numbers in JavaScript are supposed to be IEEE 754 floating-point numbers. A consequence of this is, effectively, that 0.1 + 0.2 will never be 0.3 (in the sense of the === operator in JavaScript). So what can be done?
There’s an npm library out there, decimal.js, that provides support for arbitrary precision decimals. There are probably other libraries out there that have similar or equivalent functionality.
As you might imagine, the issue under discussion is old. There are workarounds using a library.
But what about extending the language of JavaScript so that the equation does get validated? Can we make JavaScript work with decimals correctly, without using a library?
Yes, we can.
Aside: Huge integers
It’s worth thinking about a similar issue that also arises from the finiteness of our machines: arbitrarily large integers in JavaScript. Out of the box, JavaScript didn’t support extremely large integers. You’ve got 32-bit or (more likely) 64-bit signed integers. But even though that’s a big range, it’s still, of course, limited. BigInt, a proposal to extend JS with precisely this kind of thing, reached Stage 4 in 2019, so it should be available in pretty much every JavaScript engine you can find. Go ahead and fire up Node or open your browser’s inspector and plug in the number of nanoseconds since the Big Bang:
(Not a scientician. May not be true. Not intended to be a factual claim.)
Adding big decimals to the language
OK, enough about big integers. What about adding support for arbitrary precision decimals in JavaScript? Or, at least, high-precision decimals? As we see above, we don’t even need to wrack our brains trying to think of complicated scenarios where a ton of digits after the decimal point are needed. Just look at 0.1 + 0.2 = 0.3. That’s pretty low-precision, and it still doesn’t work. Is there anything analogous to BigInt for non-integer decimal numbers? No, not as a library; we already discussed that. Can we add it to the language, so that, out of the box—with no third-party library—we can work with decimals?
The answer is yes. Work is proceeding on this matter, but things remain to unsettled. The relevant proposal is BigDecimal. I’ll be working on this for a while. I want to get big decimals into JavaScript. There are all sorts of issues to resolve, but they’re definitely resolvable. We have experience with arbitrary precision arithmetic in other languages. It can be done.
So yes, floating-point math is broken in JavaScript, but help is on the way. You’ll see more from me here as I tackle this interesting problem; stay tuned!
Kernel Recipes is an amazing conference and it is unique in several different
ways. First of all because it is community-oriented, and the environment is
really open and friendly. And then because it has a single track – i.e. all
the talks are in the same room – people don't need to choose which talks to
attend: they'll attend all of them. Oh, and there was even a person (Anisse
Astier) that was doing live blogging. How awesome is that?
This year I managed to attended this conference for the first time, in its usual
place: in Paris, in the Cité Internationale campus.
All the sessions were recorded and the videos are available at the conference
website so that people can (re)watch them. For this reason, in this post I am
not going through all that talks I've watched, but I would like to mention a few
of them that I personally (and very subjectively!) found more interesting.
The first two I'd like to mention are those from my Igalian friends, of course!
Melissa Wen has done a talk named Kworkflow: Mix & Match Kernel Recipes
End-to-end. This talk was about Kernel workflow, which is an interface that
glues together a set of tools and scripts into a single unified interface. The
other talk from Igalia was delivered by Maíra Canal, and was about the evolution
of the Rust programming language usage within the DRM subsystem. Her talk was
named A Rusty Odyssey: A Timeline of Rust in the DRM subsystem.
As expected, there were plenty of different areas covered by the talks, but the
ones that I found most exciting were those related with memory management. And
there were a few of them. The first one was from Lorenzo Stokes (the guy that
wrote "the book"!). He delivered the talk Where does my memory come from?,
explaining this "simple" thing: what exactly happens when an user-space
application does malloc()?
The second talk related with memory management was from Matthew Wilcox, touching
different aspects of how reclaiming memory from within the VFS (and in file
systems in general) can be tricky. Unsurprisingly, the name of his talk was
Filesystem & Memory Reclaim.
The last memory management related talk was from Vlastimil Babka, which talked
about the contents of the /proc/vmstat file in a talk named Observing the
memory mills running.
The last talk I'd like to mention was Alice Ryhl's So you want to write a driver
in Rust? It's not that I'm a huge Rust enthusiast myself, or that I actually
know how to program in Rust (I do not!). But it was a nice talk for someone
looking for a good excuse to start looking into this programming language and
maybe get the missing push to start learning it!
Finally, a Huge Thanks to the organisation (and all the sponsors, of course)
as they definitely manage to keep a very high quality conference in such a
friendly environment. Looking forward for Kernel Recipes 2026!
Yesterday a colleague of mine was asking around for a way to get their GNOME desktop to always ask which browser to use when a third-party application wants to open a hyperlink. Something like that:
If no browser has ever been registered as the default handler for the HTTP/HTTPS schemes, then the first time around that dialog would theoretically pop up. But that’s very unlikely. And as another colleague pointed out, there is no setting to enforce the “always ask” option.
So I came up with a relatively self-contained hack to address this specific use case, and I’m sharing it here in case it’s useful to others (who knows?), to my future self, or for your favourite LLM to ingest, chew and regurgitate upon request.
First, drop a desktop file that invokes the OpenURI portal over D-Bus in ~/.local/share/applications:
Note that a slightly annoying side effect is that your preferred browser will likely complain that it’s not the default any longer.
You can at any time revert to associating these schemes to your preferred browser, e.g.:
$ xdg-settings set default-web-browser firefox.desktop
Note that I mentioned GNOME at the beginning of this post, but this should work in any desktop environment that provides an XDG desktop portal backend for the OpenURI interface.
✏️ EDIT: My colleague Philippe told me about Junction, a dedicated tool that addresses this very use case, with a much broader scope. It appears to be GNOME-specific, and is neatly packaged as a flatpak. An interesting project worth checking out.
Update on what happened in WebKit in the week from September 29 to October 6.
Another exciting weekful of updates, this time we have a number of fixes on
MathML, content secutiry policy, and Aligned Trusted types, public API for
WebKitWebExtension has finally been added, and fixed enumeration of speaker
devices. In addition to that, there's ongoing work to improved compatibility
for broken AAC audio streams in MSE, a performance improvement to text
rendering with Skia was merged, and fixed multi-plane DMA-BUF handling in WPE.
Last but not least, The 2026 edition of the Web Engines Hackfest has been
announced! It will take place from June 15th to the 17th.
In JavaScriptCore's implementation of Temporal, improved the precision of calculations with the total() function on Durations. This was joint work with Philip Chimento.
In JavaScriptCore's implementation of Temporal, continued refactoring addition for Durations to be closer to the spec.
Graphics 🖼️
Landed a patch to build a SkTextBlob when recording DrawGlyphs operations for the GlyphDisplayListCache, which shows a significant improvement in MotionMark “design” test when using GPU rendering.
WPE WebKit 📟
WPE Platform API 🧩
New, modern platform API that supersedes usage of libwpe and WPE backends.
Improvedwpe_buffer_import_to_pixels() to work correctly on non-linear and multi-plane DMA-BUF buffers by taking into account their modifiers when mapping the buffers.
It has been a while since my last post, I know. Today I just want to thank Igalia for continuing to give me and many other Igalians the opportunity to attend XDC. I had a great time in Vienna where I was able to catch up with other Mesa developers (including Igalians!) I rarely have the opportunity to see face to face. It is amazing to see how Mesa continues to gain traction and interest year after year, seeing more actors and vendors getting involved in one way or another… the push for open source drivers in the industry is real and it is fantastic to see it happening.
I’d also like to thank the organization, I know all the work that goes into making these things happen, so big thanks to everyone who was involved, and to the speakers, the XDC program is getting better every year.
A lot more words on a short statement I made last week on social media...
A couple of weeks ago I posted on social media that
It never ceases to amaze me how much stuff there is on the web platform that needs more attention than it gets in practice, despite vendors spending tons already.
Dave Rupert replied asking
could you itemize that list? i'd be curious. seems like new shiny consumes a lot of the efforts.
I said "no" at the time because it's true it would be a very long list and exceptionally time consuming task if exhaustive, but... It is probably worth rattling off a bunch that I know more or less off the top of my head from experience - so here goes (in no particular order)... I'll comment on a few:
Big general areas...
There are certain areas of focus that just always get shoved to the back burner.
Print
It's almost absurd to me that printing and print related APIs have the problems and concerns that they still do given that so much of enterprise and government are web based. For example: Will your images be loaded? Who knows! Did you know there is a .print() and it doesn't act the same in several respects as choosing print from the menu? Shouldn't the browser support many of the CSS based features that print pioneered? Like... paging? Or at least actually investing in considering it in the browser at the same time could have helped us determine if those were even good ideas or shape APIs.
Accessibility
In theory all of the processes are supposed to help create standards and browsers that are accessible - in practice, we miss on this more often than is comfortable to admit. This is mainly because - for whatever reason - so much of this, from reviews to testing to standards work in designing APIs in the first place, is largely done by volunteers or people disconnected from vendors themselves and just trying to keep up. My colleague Alice Boxhall wrote a piece that touches on this, and more.
Internationalization
Probably in better shape than accessibility in many ways, but the same basic sorts of things apply here.
Testing Infrastructure
The amount of things that we are incapable of actually testing is way higher than we should be comfortable with. The web actually spent the first 15 years or so of its life without any actual shared testing like web platform tests. Today, lots and lots of that infrastructure is just Google provided, so not community owned or anything.
Forgotten tech
Then there aere are certain big, important projects that were developed and have been widely deployed for ten, or even close to twenty years at this point, but were maybe a little wonky or buggy and then just sort of walked away from.
SVG
After some (like Amelia) doing amazing work to begin to normalize SVG and CSS, the working group effectively disbanded for years with very little investment from vendors.
MathML
From its integration in HTML5 until today, almost none of the work done in browsers has been by the browser vendors themselves. Google is the only vendor who has even joined the working group, and not so much to participate as an org as much as to allow someone interested on their own to participate.
Web Speech
Google and others were so excited to do this back in (checks watch)... 2012. But they did it too early, and in a community group. It's not even a Recommendation Track thing. I can easily see an argument to be made that this is the result of things swinging pretty far in the other direction - this is more than a decade after W3C had put together the W3C Speech Interface Framework with lots of XML. But meanwhile there is simple and obvious bugs and improvements that can and should be made - there is lots of be rethought here and very little invested from then till now.
The "wish list"
There is a long list of things that we, as a larger community, aren't investing in in the sense of wider particpation and real funding from browsers, but I think we should... Here are a few of my top ones:
Study of the web (and ability to)
The HTTPArchive and chrome status are about the best tools we have, but they're again mainly Google - but even other data sources are biased and incomplete. Until 2019 the study of elements on the web was just running a regexp on home pages in the archive. Until just a year or two ago our study of CSS was kind of similar. It just feels like we should have more here.
Polyfill ability for CSS
A number of us have been saying this for a long time. Even some small things could go a long way here (like, just really exposing what's parsed). After a lot of efforts we got Houdini, which should have helped answer a lot of this. It fizzled out after choosing probably the least interesting first project in my opinion. I don't know that we were looking at it just right, or that we would have done the right things - but I know that not really investing in trying isn't going to get it done either. To be really honest, I'd like a more perfect polyfill story for HTML as well. Once upon a time there was discussion down that road, but when <std-toast>-gate happened, all of the connected discussions died along with it. That's a shame. We are getting there slowly with some important things like custom media queries and so on, but a lot of these things we were starting to pitch a decade ago.
Protocols
The web has thus far been built a very particular way - but there are many ideas (distributed web ideas, for example) which it's very hard for the web to currently adapt toward because it's full of hard problems that really need involvement from vendors. I'd love to see many of those ideas really have an opportunity to take off, but I don't see good evolutionary paths to allow something to really do that. We had some earlier ideas like protocol handlers and content handlers for how this might work. Unfortunately content handlers were removed, and prototcol handlers are extremely limited and incomplete. Trying to imagine how a distributed web could work is pretty difficult with the tools we have. Perhaps part of this is related other items on my list like powerful features or monetization
"Web Views" / "Powerful features"
A ton of stuff is built with web technology as apps to get around some of the things that are currently difficult security-wide or privacy wise in the browser itself. Maybe that's how it should be, maybe it isn't. I'm not here to say "ship all the fugu stuff" or something, but it it definitely seems silly that there aren't some efforts to even think "above" the browser engines and standardize some APIs, a bit in the vein of what is now the Winter TC. What people are doing today doesn't seem better. I guesss there is a common theme here that I'd like to really invest in finding better ways to let the platform evolve a bit on its own and then pick it up and run with it.
"monetization"
I mean, this is a really tough one for so many reasons, both tehnical and political, but I just don't see a thing that could have bigger impact than a way to pay creators that isn't limited to ads and a way to fund new ideas. It just seems at the very core of a lot of things. I put it in quotes because I don't mean specifically the proposal called web monetization. There are lots of other ideas and a wide range of attempts happening, some of them seem less directly like money and more like ways to express licencing agreements or earn discounts.
Maps
We seem to have mostly just written off maps entirely as something which you just rely on Google Maps or Apple Maps for. That's a shame because there has been interest at several levels - there was a joint OGC/W3C workshop a few years ago, and many ideas. Almost all of them would benefit more than just those few proprietary map systems. There are even simple primitive ideas like adding the concept of pan and zoom to the platform, maybe in CSS. Surely we can do better than where things are right now, but who is going to invest to get it there?
There's a long list
There's way more things we could list here... Drag and drop needs work and improvements. Editing (see Contenteditable/execCommand/EditContext) is terribly hard. Given the importance, you'd think it would be one of the bigger areas of investment, but it's not really. Hit testing is a big area that needs defining. I mean, you can see that this year we got 134 focus area proposals for Interop 2026. Those aren't all areas that are under-invested in, exactly, but whatever we choose to focus on there is time and budget we can't spend on the things in this list...
In the past, I might have said documentation, but I feel like were just doing a lot better with that. We also now have the collectively funded, transparent and independent openwebdocs.org which Igalia has helped fund since its inception and, to my mind, is one of the most positive things. So many things on this list even could take a similar approach. It would be great to see.
Update on what happened in WebKit in the week from September 22 to September 29.
Many news this week! We've got a performance improvement in the Vector
implementation, a fix that makes a SVG attribute work similarly to HTML,
and further advancements on WebExtension support. We also saw an update
to WPE Android, the test infrastructure can now run WebXR tests, WebXR
support in WPE Android, and a rather comprehensive blog post about the
performance considerations of WPE WebKit with regards to the DOM tree.
Cross-Port 🐱
Vector copies performance was improved across the board, and specially for MSE use-cases
Fixed SVG <a> rel attribute to work the same as HTML <a>'s.
Work on WebExtension support continues with more Objective-C converted to C++, which allows all WebKit ports to reuse the same utility code in all ports.
WPE now supports importing pixels from non-linear DMABuf formats since commit 300687@main. This will help the work to make WPE take screenshots from the UIProcess (WIP) instead of from the WebProcess, so they match better what's actually shown on the screen.
Adaptation of WPE WebKit targeting the Android operating system.
WPE-Android is being updated to use WPE WebKit 2.50.0. As usual, the ready-to-use packages will arrive in a few days to the Maven Central repository.
Added support to run WebXR content on Android, by using AHarwareBuffer to share graphics buffers between the main process and the content rendering process. This required coordination to make the WPE-Android runtime glue expose the current JavaVM and Activity in a way that WebKit could then use to initialize the OpenXR platform bindings.
Community & Events 🤝
Paweł Lampe has published in his blog the first post in a series about different aspects of Web engines that affect performance, with a focus on WPE WebKit and interesting comparisons between desktop-class hardware and embedded devices. This first article analyzes how “idle” nodes in the DOM tree render measurable effects on performance (pun intended).
Infrastructure 🏗️
The test infrastructure can now run API
tests that need WebXR support, by
using a dummy OpenXR compositor provided by the Monado
runtime, along with the first tests and an additional one
that make use of this.
Welcome to the second part in this series on how to get perf to work on ARM32. If you just arrived here and want to know what is perf and why it would be useful, refer to Part 1—it is very brief. If you’re already familiar with perf, you can skip it.
To put it blunty, ARM32 is a bit of a mess. Navigating this mess is a significant part of the difficulty in getting perf working. This post will focus on one of these messy parts: the ISAs, plural.
The ISA (Instruction Set Architecture) of a CPU defines the set of instructions and registers available, as well as how they are encoded in machine code. ARM32 CPUs generally have not one but two coexisting ISAs: ARM and Thumb, with significant differences between each other.
Unlike, let’s say, 32-bit x86 and 64-bit x86 executables running in the same operating system, ARM and Thumb can and often do coexist in the same process and have different sets of instructions and—to a certain extent—registers available, all while targetting the same hardware, and neither ISA being meant as a replacement of the other.
If you’re interested in this series as a tutorial, you can probably skip this one. If, on the other hand, you want to understand these concepts to be better for when they inevitably pop up in your troubleshooting—like it did in mine—keep reading. This post will explain some consequential features of both ARM and Thumb, and how they are used in Linux.
I highly recommend having a look at old ARM manuals for following this post. As it often happens with ISAs, old manuals are much more compact and easier to follow than the than current versions, making them a good choice for grasping the fundamentals. They often also have better diagrams, that were only possible when the CPUs were simpler—the manuals for the ARM7TDMI (a very popular ARMv4T design for microcontrollers from the late 90s) are particularly helpful for introducing the architecture.
Some notable features of the ARM ISA
(Recommended introductory reference: ARM7TDMI Manual (1995), Part 4: ARM Instruction Set. 64 pages, including examples.)
The ARM ISA has a fixed instruction size of 32 bits.
A notable feature of it is that the 4 most significant bits of each instruction contain a condition code. When you see mov.ge in assembly for ARM, that is the regular mov instruction with the condition code 1010 (GE: Greater or Equal). The condition code 1110 (AL: Always) is used for non-conditional instructions.
ARM has 16 directly addressable registers, named r0 to r15. Instructions use 4-bit fields to refer to them.
The ABIs give specific purposes to several registers, but as far as the CPU itself goes, there are very few special registers:
r15 is the Program Counter (PC): it contains the address of the instruction about to be executed.
r14 is meant to be used as Link Register (LR)—it contains the address a function will jump to on return. This is used by the bl (Branch with link) instruction, which before branching, will also update r14 (lr) with the value of r15 (pc), and is the main instruction used for function calls in ARM.
All calling conventions I’m aware of use r13 as a full-descending stack. “Full stack” means that the register points to the last item pushed, rather than to the address that will be used by the next push (“open stack”). “Descending stack” means that as items are pushed, the address in the stack register decreases, as opposed to increasing (“ascending stack”). This is the same type of stack used in x86.
The ARM ISA does not make assumptions about what type of stack programs use or what register is used for it, however. For stack manipulation, ARM has a Store Multiple (stm)/Load Multiple (ldm) instruction, which accepts any register as “stack register” and has flags for whether the stack is full or open, ascending or descending and whether the stack register should be updated at all (“writeback”). The “multiple” in the name comes from the fact that instead of having a single register argument, it operates on a 16 bit field representing all 16 registers. It will load or store all set registers, with lower index registers matched to lower addresses in the stack.
push and pop are assembler aliases for stmfd r13! (Store Multiple Full-Descending on r13 with writeback) and ldmfd r13! (Load Multiple Full-Descending on r13 with writeback) respectively—the exclamation mark means writeback in ARM assembly code.
Some notable features of the Thumb ISA
(Recommended introductory reference: ARM7TDMI Manual (1995), Part 5: Thumb Instruction Set. 47 pages, including examples.)
The Thumb-1 ISA has a fixed instruction size of 16 bits. This is meant to reduce code size, improve cache performance and make ARM32 competitive in applications previously reserved for 16-bit processors. Registers are still 32 bit in size.
As you can imagine, having a fixed 16 bit size for instructions greatly limits what functionality is available: Thumb instructions generally have an ARM counterpart, but often not the other way around.
Most instructions—with the notable exception of the branch instruction—lack condition codes. In this regards it works much more like x86.
The vast majority of instructions only have space for 3 bits for indexing registers. This effectively means Thumb has only 8 registers—so called low registers—available to most instructions. The remaining registers—referred as high registers—are only available in special encodings of few select instructions.
Store Multiple (stm)/Load Multiple(ldm) is largely replaced by push and pop, which here is not an alias but an actual ISA instruction and can only operate on low registers and—as a special case—can push LR and pop PC. The only stack supported is full-descending on r13 and writeback is always performed.
A limited form of Store Multiple (stm)/Load Multiple (ldm) with support for arbitrary low register as base is available, but it can only load/store low registers, writeback is still mandatory, and it only supports one addressing mode (“increment after”). This is not meant for stack manipulation, but for writing several registers to/from memory at once.
Switching between ARM and Thumb
(Recommended reading: ARM7TDMI Manual (1995), Part 2: Programmer’s Model. 3.2 Switching State. It’s just a few paragraphs.)
All memory accesses in ARM must be 32-bit aligned. Conveniently, this allows the 4 least significant bit of addresses to be used as flags, and ARM CPUs make use of this.
When branching with the bx (Branch with exchange) instruction, the least significant bit of the register holding the branch address indicates whether the CPU should swich after the jump to ARM mode (0) or Thumb mode (1).
It’s important to note that this bit in the address is just a flag: Thumb instructions lie in even addresses in memory.
As a result, ARM and Thumb code can coexist in the same program and applications can use libraries compiled with each other mode. This is far from an esoteric feature; as an example, buildroot always compiles glibc in ARM mode, even if Thumb is used for the rest of the system.
Thumb-2 is an extension of the original Thumb ISA. Instructions are no longer fixed 16 bits in size, but instead instructions have variable size (16 or 32 bits).
This allows to reintroduce a lot of functionality that was previously missing in Thumb but only pay for the increased code size in instructions that require it. For instance, push now can save high registers, but it will become a 32-bit instruction when doing so.
Just like in Thumb-1, most instructions still lack condition codes. Instead, Thumb-2 introduces a different mechanism for making instructions conditional: the If-Then (it) instruction. it receives a 4 bit condition code (same as in ARM) and a clever 4 bit “mask”. The it instruction makes execution of the following up to 4 instructions conditional on either the condition or its negation. The first instruction is never negated.
An “IT block” is the sequence of instructions made conditional by a previous it instruction.
For instance, the 16-bit instruction ittet ge means: make the next 2 instructions conditional on “greater or equal”, the following instruction conditional on “less than (i.e. not greater or equal)”, and the following instruction conditional on “greater or equal”. ite eq would make the following instruction be conditional on “equal” and the following instruction conditional on “not equal”.
The IT block deprecation mess:Some documentation pages of ARM will state that it instructions followed by 32 bit instructions, or by more than one instruction, are deprecated. According to clang commits from 2022, this decision has been since reverted. The current (2025) version of the ARM reference manual for the A series of ARM CPUs remains vague about this, claiming “Many uses of the IT instruction are deprecated for performance reasons” but doesn’t claim any specific use as deprecated in that same page. Next time you see gcc or GNU Assembler complaining about a certain IT block being “performance deprecated”, this is what that is about.
Assembly code compatibility
Assemblers try to keep ARM and Thumb as mutually interchangeable where possible, so that it’s possible to write assembly code that can be assembled as either as long as you restrict your code to instructions available in both—something much more feasible since Thumb-2.
For instance, you can still use it instructions in code you assemble as ARM. The assembler will do some checks to make sure your IT block would work in Thumb the same as it would do if it was ARM conditional instructions and then ignore it. Conversely, instructions inside an IT block need to be tagged with the right condition code for the assembler to not complain, even if those conditions are stripped when producing Thumb.
What determines if code gets compiled as ARM or Thumb
If you try to use a buildroot environment, one of the settings you can tweak (Target options/ARM instruction set) is whether ARM or Thumb-2 should be used as default.
When you build gcc from source one of the options you can pass to ./configure is --with-mode=arm (or similarly, --with-mode=thumb). This determines which one is used by default—that is, if the gcc command line does not specify either. In buildroot, when “Toolchain/Toolchain type” is configured to use “Buildroot toolchain”, buildroot builds its own gcc and uses this option.
To specify which ISA to use for a particular file you can use the gcc flags -marm or -mthumb. In buildroot, when “Toolchain/Toolchain type” is configured to use “External toolchain”—in which case the compiler is not compiled from source—either of these flags is added to CFLAGS as a way to make it the default for packages built with buildroot scripts.
A mode can also be overriden on a per-function-basis with __attribute__((target("thumb")). This is not very common however.
GNU Assembler and ARM vs Thumb
In GNU Assembler, ARM or Thumb is selected with the .arm or .thumb directives respectively—alternatively, .code 16 and .code 32 respectively have the same effect.
Each functions that starts with Thumb code must be prefaced with the .thumb_func directive. This is necessary so that the symbol for the function includes the Thumb bit, and therefore branching to the function is done in the correct mode.
ELF object files
There are several ways ELF files can encode the mode of a function, but the most common and most reliable is to check the addresses of the symbols. ELF files use the same “lowest address bit means Thumb” convention as the CPU.
Unfortunately, while tools like objdump need to figure the mode of functions in order to e.g. disassemble them correctly, I have not found any high level flag in either objdump or readelf to query this information. Instead, here you can have a couple of Bash one liners using readelf.
The regular expression matches on the parity of the address.
$p is an optional variable I assign to my compiler prefix (e.g. /br/output/host/bin/arm-buildroot-linux-gnueabihf-). Note however that since the above commands just use readelf, they will work even without a cross-compiling toolchain.
THUMB_FUNC is written by readelf when a symbol has type STT_ARM_TFUNC. This is another mechanism I’m aware object files can use for marking functions as Thumb, so I’ve included it for completion; but I have not found any usages of it in the wild.
If you’re building or assembling debug symbols, ranges of ARM and Thumb code are also marked with $a and $t symbols respectively. You can see them with readelf --syms. This has the advantage—at least in theory—of being able to work even in the presence of ARM and Thumb mixed in the same function.
Closing remarks
I hope someone else finds this mini-introduction to ARM32 useful. Now that we have an understanding of the ARM ISAs, in the next part we will go one layer higher and discuss the ABIs (plural again, tragically!)—that is, what expectations have functions of each other as they call one another.
In particular, we are interested in how the different ABIs handle—or not—frame pointers, which we will need in order for perf to do sampling profiling of large applications on low end devices with acceptable performance.
Designing performant web applications is not trivial in general. Nowadays, as many companies decide to use web platform on embedded devices, the problem of designing performant web applications becomes even more complicated.
Typical embedded devices are orders of magnitude slower than desktop-class ones. Moreover, the proportion between CPU and GPU power is commonly different as well. This usually results in unexpected performance bottlenecks
when the web applications designed with desktop-class devices in mind are being executed on embedded environments.
In order to help web developers approach the difficulties that the usage of web platform on embedded devices may bring, this blog post initiates a series of articles covering various performance-related aspects
in the context of WPE WebKit usage on embedded devices. The coverage in general will include:
introducing the demo web applications dedicated to showcasing use cases of a given aspect,
benchmarking and profiling the WPE WebKit performance using the above demos,
discussing the causes for the performance measured,
inferring some general pieces of advice and rules of thumb based on the results.
This article, in particular, discusses the overhead of nodes in the DOM tree when it comes to layouting. It does that primarily by investigating the impact of idle nodes that introduce the least overhead and hence
may serve as a lower bound for any general considerations. With the data presented in this article, it should be clear how the DOM tree size/depth scales in the case of embedded devices.
Historically, the DOM trees emerging from the usual web page designs were rather limited in size and fairly shallow. This was the case as there were
no reasons for them to be excessively large unless the web page itself had a very complex UI. Nowadays, not only are the DOM trees much bigger and deeper, but they also tend to contain idle nodes that artificially increase
the size/depth of the tree. The idle nodes are the nodes in the DOM that are active yet do not contribute to any visual effects. Such nodes are usually a side effect of using various frameworks and approaches that
conceptualize components or services as nodes, which then participate in various kinds of processing utilizing JavaScript. Other than idle nodes, the DOM trees are usually bigger and deeper nowadays, as there
are simply more possibilities that emerged with the introduction of modern APIs such as Shadow DOM,
Anchor positioning, Popover, and the like.
In the context of web platform usage on embedded devices, the natural consequence of the above is that web designers require more knowledge on how the particular browser performance scales with the DOM tree size and shape.
Before considering embedded devices, however, it’s worth to take a brief look at how various web engines scale on desktop with the DOM tree growing in depth.
In short, the above demo measures the average duration of a benchmark function run, where the run does the following:
changes the text of a single DOM element to a random number,
forces a full tree layout.
Moreover, the demo allows one to set 0 or more parent idle nodes for the node holding text, so that the layout must consider those idle nodes as well.
The parameters used in the URL above mean the following:
vr=0 — the results are reported to the console. Alternatively (vr=1), at the end of benchmarking (~23 seconds), the result appears on the web page itself.
ms=1 — the results are reported in “milliseconds per run”. Alternatively (ms=0), “runs per second” are reported instead.
dv=0 — the idle nodes are using <span> tag. Alternatively, (dv=1) <div> tag is used instead.
ns=N — the N idle nodes are added.
The idea behind the experiment is to check how much overhead is added as the number of extra idle nodes (ns=N) in the DOM tree increases. Since the browsers used in the experiments are not fair to compare due to various reasons,
instead of concrete numbers in milliseconds, the results are presented in relative terms for each browser separately. It means that the benchmarking result for ns=0 serves as a baseline, and other results show the relative duration
increase to that baseline result, where, e.g. a 300% increase means 3 times the baseline duration.
The results for a few mainstream browsers/browser engines (WebKit GTK MiniBrowser [09.09.2025], Chromium 140.0.7339.127, and Firefox 142.0) and a few experimental ones (Servo [04.07.2024] and Ladybird [30.06.2024])
are presented in the image below:
As the results show, trends among all the browsers are very close to linear. It means that the overhead is very easy to assess, as usually N times more idle nodes will result in N
times the overhead.
Moreover, up until 100-200 extra idle nodes in the tree, the overhead trends are very similar in all the browsers except for experimental Ladybird. That in turn means that even for big web applications, it’s safe to
assume the overhead among the browsers will be very much the same. Finally, past the 200 extra idle nodes threshold, the overhead across browsers diverges. It’s very likely due to the fact that the browsers are not
optimizing such cases as a result of a lack of real-world use cases.
All in all, the conclusion is that on desktop, only very large / specific web applications should be cautious about the overhead of nodes, as modern web browsers/engines are very well optimized for handling substantial amounts
of nodes in the DOM.
When it comes to the embedded devices, the above conclusions are no longer applicable. To demonstrate that, a minimal browser utilizing WPE WebKit is used to run the demo from the previous section both on desktop and
NXP i.MX8M Plus platforms. The latter is a popular choice for embedded applications as it has quite an interesting set of features while still having strong specifications, which may be compared to those of Raspberry Pi 5.
The results are presented in the image below:
This time, the Y axis presents the duration (in milliseconds) of a single benchmark run, and hence makes it very easy to reason about overhead. As the results show, in the case of the desktop, 100 extra idle nodes in the DOM
introduce barely noticeable overhead. On the other hand, on an embedded platform, even without any extra idle nodes, the time to change and layout the text is already taking around 0.6 ms. With 10 extra idle nodes, this
duration increases to 0.75 ms — thus yielding 0.15 ms overhead. With 100 extra idle nodes, such overhead grows to 1.3 ms.
One may argue if 1.3 ms is much, but considering an application that e.g. does 60 FPS rendering, the
time at application disposal each frame is below 16.67 ms, and 1.3 ms is ~8% of that, thus being very considerable. Similarly, for the application to be perceived as responsive, the input-to-output latency should usually
be under 20 ms. Again, 1.3 ms is a significant overhead for such a scenario.
Given the above, it’s safe to state that the 20 extra idle nodes should be considered the safe maximum for embedded devices in general. In case of low-end embedded devices i.e. ones comparable to Raspberry Pi 1 and 2,
the maximum should be even lower, but a proper benchmarking is required to come up with concrete numbers.
While the previous subsection demonstrated that on embedded devices, adding extra idle nodes as parents must usually be done in a responsible way, it’s worth examining if there are nuances that need to be considered as
well.
The first matter that one may wonder about is whether there’s any difference between the overhead of idle nodes being inlines (display: inline) or blocks (display: block). The intuition here may be that, as idle nodes
have no visual impact on anything, the overhead should be similar.
To verify the above, the demo from Desktop considerations section can be used with dv parameter used to control whether extra idle nodes should be blocks (1, <div>) or inlines (0, <span>).
The results from such experiments — again, executed on NXP i.MX8M Plus — are presented in the image below:
While in the safe range of 0-20 extra idle nodes the results are very much similar, it’s evident that in general, the idle nodes of block type are actually introducing more overhead.
The reason for the above is that, for layout purposes, the handling of inline and block elements is very different. The inline elements sharing the same line can be thought of as being flattened within so called
line box tree. The block elements, on the other hand, have to be represented in a tree.
To show the above visually, it’s interesting to compare sysprof flamegraphs of WPE WebProcess from the scenarios comprising 20 idle nodes and using either <span> or <div> for idle nodes:
idle <span> nodes:
idle <div> nodes:
The first flamegraph proves that there’s no clear dependency between the call stack and the number of idle nodes. The second one, on the other hand, shows exactly the opposite — each of the extra idle nodes is
visible as adding extra calls. Moreover, each of the extra idle block nodes adds some overhead thus making the flamegraph have a pyramidal shape.
Another nuance worth exploring is the overhead of text nodes created because of whitespaces.
When the DOM tree is created from the HTML, usually a lot of text nodes are created just because of whitespaces. It’s because the HTML usually looks like:
<span>
  <span>
    (...)
  </span>
</span>
rather than:
<span><span>(...)</span></span>
which makes sense from the readability point of view. From the performance point of view, however, more text nodes naturally mean more overhead. When such redundant text nodes are combined with
idle nodes, the net outcome may be that with each extra idle node, some overhead will be added.
To verify the above hypothesis, the demo similar to the above one can be used along with the above one to perform a series of experiments comparing the approach with and without redundant whitespaces:
random-number-changing-in-the-tree-w-whitespaces.html?vr=0&ms=1&dv=0&ns=0.
The only difference between the demos is that the w-whitespaces one creates the DOM tree with artificial whitespaces, simulating as-if it was written in the formatted document. The comparison results
from the experiments run on NXP i.MX8M Plus are presented in the image below:
As the numbers suggest, the overhead of redundant text nodes is rather small on a per-idle-node basis. However, as the number of idle nodes scales, so does the overhead. Around 100 extra idle nodes, the
overhead is noticeable already. Therefore, a natural conclusion is that the redundant text nodes should rather be avoided — especially as the number of nodes in the tree becomes significant.
The last topic that deserves a closer look is whether adding idle nodes as siblings is better than adding them as parent nodes. In theory, having extra nodes added as siblings should be better as the layout engine
will have to consider them, yet it won’t mark them with a dirty flag and hence it won’t have to layout them.
The experiment results corroborate the theoretical considerations made above — idle nodes added as siblings indeed introduce less layout overhead. The savings are not very large from a single idle node perspective,
but once scaled enough, they are beneficial enough to justify DOM tree re-organization (if possible).
The above experiments mostly emphasized the idle nodes, however, the results can be extrapolated to regular nodes in the DOM tree. With that in mind, the overall conclusion to the experiments done in the former sections
is that DOM tree size and shape has a measurable impact on web application performance on embedded devices. Therefore, web developers should try to optimize it as early as possible and follow the general rules of thumb that
can be derived from this article:
Nodes are not free, so they should always be added with extra care.
Idle nodes should be limited to ~20 on mid-end and ~10 on low-end embedded devices.
Idle nodes should be inline elements, not block ones.
Redundant whitespaces should be avoided — especially with idle nodes.
Nodes (especially idle ones) should be added as siblings.
Although the above serves as great guidance, for better results, it’s recommended to do the proper browser benchmarking on a given target embedded device — as long as it’s feasible.
Also, the above set of rules is not recommended to follow on desktop-class devices, as in that case, it can be considered a premature optimization. Unless the particular web application yields an exceptionally large
DOM tree, the gains won’t be worth the time spent optimizing.
Update on what happened in WebKit in the week from September 15 to September 22.
The first release in a new stable series is now out! And despite that,
the work continues on WebXR, multimedia reliability, and WebExtensions
support.
Cross-Port 🐱
Fixed running WebXR tests in the WebKit build infrastructure, and made a few more of them run. This both increases the amount of WebXR code covered during test runs, and helps prevent regressions in the future.
As part of the ongoing work to get WebExtensions support in the GTK and WPE WebKit ports, a number of classes have been convertedfrom Objective-Cto C++, in order to use share their functionality among all ports.
Multimedia 🎥
GStreamer-based multimedia support for WebKit, including (but not limited to) playback, capture, WebAudio, WebCodecs, and WebRTC.
WebKitGTK 2.50.0 and WPE WebKit 2.50.0 are now available. These are the first releases of a new stable series, and are the result of the last six months of work. This development cycle focused on rendering performance improvements, improved support for font features, and more. New public API has been added to obtain the theme color declared by Web pages.
For those longer to integrate newer releases, which we know can be a longer process when targeting embedded devices, we have also published WPE WebKit 2.48.7 with a few stability and security fixes.
Accompanying these releases there is security advisory WSA-2025-0006 (GTK, WPE), with information about solved security issues. As usual, we encourage everybody to use the most recent versions where such issues are known to be fixed.
Last weekend we had the opportunity to talk about Servo at GOSIM Hangzhou 2025. This was my first time in Asia, a long trip going there but a wonderful experience nevertheless.
My talk was Servo: A new web engine written in Rust and it was an introductory talk about the Servo project focusing on the evolution since 2023 when Igalia took over the project maintenance. The talk was trying to answer a few questions:
What’s Servo?
Is it really a “new” web engine?
What makes Servo special?
What’s the project vision?
How can you help?
Myself during my Servo talk at GOSIM Hangzhou 2025
In this blog post I’m going to go over all the slides of the talk and describe the different things I was explaining during the presentation A kind of a reader view of the talk. If you want to check the slides yourself, they’re available online, and the talk recording too.
Next a quick introduction about myself and Igalia, nothing very new or fancy here compared to other previous talks I’ve done. Main highlights are that I’m Servo Technical Steering Committee (TSC) chair since 2023, I’m not working on the project as a developer but I’m helping with the coordination efforts. And regarding Igalia that we’re an open source consultancy, with a flat structure, and top contributors to the main web rendering engines.
First section tries to briefly explain what is Servo, specially for the people that don’t know the project yet and looking into clarifying the question about if it’s a browser, a web engine, or both.
Here the goal is to shortly describe the difference between a web browser and a web rendering engine. If you are confused about these two terms, the browser is the application that you use, the one that has a URL bar, tabs, bookmarks, history, etc. It’s a graphical chrome that allows you to browse the web. The rendering engine is the one in charge of converting the HTML plus the rest of resources (styles, JavaScript, etc.) into a visual representation that is displayed in your screen, a piece of the browser.
I also mention of browsers vs rendering engines, like Chrome and Blink, Safari and WebKit, or Firefox and Gecko.
Regarding Servo there are two things which are both equally true:
Here we see a video of Servo running, so the audience can understand what it is even better. The video shows servoshell (our minimal browser to test Servo) and stars by browsing servo.org. Then it opens Wikipedia, searches for Python, and opens the Python programming language page. From there it clicks on the Python website, and browses a little bit the documentation. Finally it opens Baidu maps, and searches for the GOSIM conference venue.
This is a brief summary of Servo’s project history. The project was started by Mozilla in 2012, at that time they were developing the Rust language itself (somehow Mozilla used Servo, a web rendering engine, as a testing project to check that Rust language was good enough). In any case we cannot consider it really “new”, but Servo is way younger than other web engines that started decades before.
In 2020, Mozilla layoff the whole Servo team, and transferred the project to Linux Foundation. That very same year the Servo team had started the work in a new layout engine. The layout engine is an important and complex part of a web engine, it’s the one that calculates the size and position of the different elements of the website. Servo was starting a new layout engine, closer to the specifications language and with similar principles to what other vendors were also doing (Blink with LayoutNG and WebKit with Layout Formatting Context). This was done due to problems in the design of the original layout engine, which prevented to implement properly some CSS features like floats. So, from the layout engine point of view, Servo is quite a “new” engine.
In 2023, Igalia took over Servo project maintenance, with the main goal to bring the project back to life after a couple of years with minimal activity. That very same year the project joined Linux Foundation Europe in an attempt to regain interest from a broader set of the industry.
A highlight is that the project community has been totally renewed and Servo’s activity these days is growing and growing.
We take a look to the commits stats from GitHub, which show what was explained before. A very low period of activity between 2021 and 2022; and the recent renewed activity on the project.
If we zoom a bit the previous chart, we can look into the PRs merged since 2018 (not commits, as a PR can have multiple commits the chart differs a little bit from previous one). The chart also removes the PRs that are done by bots (like dependabot and servo-wpt-sync). Taking a look here we see that the last years have been very good for Servo, we’re now way over the numbers from 2018; almost doubling them in number of merged PRs, average monthly contributors, and average monthly contributors with more than 10 PRs merged in a month. Next is the same data in a table format:
2018
2019
2020
2021
2022
2023
2024
2025
PRs
1,188
986
669
118
65
776
1,771
1,983
Contributors
27.33
27.17
14.75
4.92
2.83
11.33
26.33/td>
41.33
Contributors ≥ 10
2.58
1.67
1.17
0.08
0.00
1.58
4.67
6.33
Legend:
PRs: total numbers of PRs merged.
Contributors: average number of contributors per month.
Contributors ≥ 10: average number of contributors that have merged more than 10 PRs per month.
Then we check the WPT pass-rates. WPT is the web platform tests suite, which all the web engines use and share. It consists in almost 2 millions subtests and the chart shows the evolution for Servo since April 2023 (when we started measuring this). It shows that the situation in 2023 was pretty bad, but today Servo is passing more than 1.7 million subtests (a 92.7% of the tests that we run, there are some tests skipped that we don’t count here).
If you are curious about this chart and want to learn more you can visit servo.org/wpt.
Reflecting more on the layout engine, we show a comparison between how google.com was rendered in 2023 (no logo, no text on the buttons, missing text, no icons, etc.) vs in 2025 (which looks way closer to what you can see in any other browser).
This emphasize the evolution of the new layout engine, and somehow re-states the concept of how “new” is Servo from that perspective.
First and foremost, Servo is written in Rust which has two very special characteristics:
Memory safety: Which means that you get less vulnerabilities related to wrong memory usage in your applications. We link to a small external audit that was run in a part of Servo and didn’t identify any important issue.
Concurrency: Rust simplifies a lot the usage of parallelism in your applications, allowing you to write faster and more energy-efficient programs.
The highlights here are that Servo is the only web engine written in Rust (while the rest are using C++). And also the only one that is using parallelism all over the place (even when it shares some parts with Firefox like Stylo and WebRender, it’s the only one using parallelism in the layout engine for example).
All this is something that makes Servo unique compared to the rest of alternatives.
Another relevant characteristic of the project is its independence. Servo is hosted under Linux Foundation Europe and managed openly by the TSC. This is in opposition to other web engines that are controlled by big corporations (like Apple, Google and Mozilla), and share a single source of funding through Google search deals and ads.
On this regard, Servo brings new opportunities looking for a bright future on the open web.
Embeddable: Servo can be used to be embedded in other applications, it has a WebView API that is under construction. We link to the made with Servo page at servo.org where people can find examples.
Modular: Servo has a bunch of crates (libraries) that are widely used in the Rust ecosystem. This modularity brings advantages and benefits the Servo project too. Some of these modules are shared with Firefox as mentioned previously.
Cross-platform: Servo supports 5 platforms. Linux, MacOS, and Windows on the desktop; together with Andorid, and OpenHarmony on mobile.
Servo is transitioning from a R&D project (how Mozilla created it originally) to a production-ready web rendering engine. There is a long path to go and we’re still walking it, the main goal is that the users start considering Servo as a viable alternative for their products.
We describe some of the recent developments. There are many more as the big community is working on many different things, but this is just a small set of relevant things that are being developed.
Incremental layout: This is a fundamental feature of any web engine. It’s related to the fact that when you modify something in a website (some text content, some color, etc.), you don’t need to re-layout the whole website and re-compute the position of all the boxes, but only the things that were modified and the ones that can be affected by those changes. Servo has now the basis of incremental layout implemented which has clearly improved performance, though it still has room for further developments.
WebDriver support: WebDriver is a spec that all the engines implement, which allows you to automate testing (clicking on a button, input some key strokes, etc.). This is a really nice feature to allow automation of tasks with Servo and improve testing coverage.
SVG support: Many many websites use SVG, specially for icons and small images. SVG is a big and complex feature that would deserve its own native implementation, but so far Servo is using a third party library called resvg to add basic SVG support. It has limitations (like animations not working) but it allows to render much better many websites.
DevTools improvements: Servo uses Firefox DevTools, this was totally broken in 2023 and there has been ongoing work to bring them back to life, and add support for more features like the networking and debugger panels. More work on this area is still needed in the future.
From the Servo governance point of view there has also been some changes recently. We have set some limits to the TSC in order to formalize Servo’s status as an independent and consensus-driven project. These changes cap the maximum number of TSC members and also limit the votes from the same organization.
The TSC has also defined different levels of collaboration within the project: contributors, maintainers, TSC members, and administrators. Since this was setup less than a year ago several people have been added to these roles (12 contributors, 22 maintainers, 17 TSC members, and 5 administrators). Thank you all for your amazing work!
This reflects the plans from the Servo community for the next months. The main highlights are:
Editability and interactivity enhancements: Things like selecting text or filling forms will be improved thanks to this work.
CSS Grid Layout support: This is an important CSS feature that many websites use and its being developed through a third party library called taffy.
Improving embedding API: As mentioned earlier this is key for applications that want to embedded Servo. We’re in the process of improving the API so we can have one that covers applications’ needs and allows us releasing versions of Servo to simplify usage.
Initial accessibility support: Servo has zero accessibility support so far (only the servoshell application has some basic accessibility). This is a challenging project as usually enabling accessibility support has a performance cost for the end user. We want to experiment with Servo and try to minimize that as much as possible, exploring possibilities of some innovative design that could use parallelism for the accessibility support too.
More performance improvements: With incremental layout things have improved a lot, but there are still plenty of work to do in this area where more optimizations can be implemented.
For more details about Servo’s roadmap check the wiki. The Servo community is discussing it these days, so there might be updates in the coming weeks.
Here we take a look to some years ahead and what we want to do with Servo as a project. Servo’s vision could be summarized as:
Leading the embeddable web rendering engines ecosystem: There are plenty of devices that need to render web content, Servo has some features that make it a very appealing solution for these scenarios.
Powering innovative applications and frameworks: Following Servo’s R&D approach of exploring new routes, Servo could help to develop applications that try new approaches and benefit from Servo’s unique characteristics.
Offering unparalleled performance, stability and modern web standards compliance: Servo aims to be a very performant and stable project that complies with the different web standards.
As a moonshot goal we can envision a general purpose web browser based on Servo, knowing this would require years of investment.
One option is to join the project as a contributor, if you are a developer or an organization interested in Servo, you could join us by visiting our GitHub organization, asking questions or doubts in the Zulip chat, and/or emailing us.
Servo is very welcoming to new contributors and we’re looking into growing a healthy ecosystem around the project.
Of course another way of helping the project is to talk about it, and spread the news about the project. We wrote weekly updates on social media, monthly blog posts with very detailed information about progress in the project. Every now and then we also produce some other content, like talks or specific blog posts about some topic.
And last, but not least, you can donate money to the Servo project as both an individual or an organization. We have two options here: GitHub sponsors and Open Collective. And if you have special needs you can always contact the project or contact Igalia to enquiry about it.
We are very grateful to all the people and companies that have been sponsoring Servo. Next is how we’re using the money so far:
Hosting costs: Servo is a big project and we have needs to rent some servers that are used as self-hosted runners to improve CI times. We’re also looking into setting up some dedicated machine to benchmark Servo’s performance.
Outreachy internships: Outreachy is an amazing organization that provides internships to participate in open source projects. Servo has been part of Outreachy in the past, and again since 2023. Our recent interns have worked on DevTools enhancements, CI improvements, and better dialogs on servoshell. We have used Servo’s Open Collective money to sponsor one internship so far, and we’re looking into repeating the experience in the future.
Improve contribution experience: Since this month we have started funding time from one of the top Servo experts, Josh Matthews (@jdm). The goal is to improve the experience for Servo contributors, Josh will put effort in different areas like reducing friction in the contribution process, removing barriers to contribution, and improving the first-time contribution experience.
After the talk there was only a question from the audience asking if Mozilla could consider replacing Gecko by Servo once Servo gets mature enough. My answer was that I believe the original plan from Mozilla when they started Servo was that, but since they stopped working on the project is not clear if something like that could happen. It’d be indeed really nice if something like this can happen in the future.
There were a couple of more people that approached me after the talk to comment some bits of it and congratulate us for the work on the project. Thank you all!
In this post, we are going to test libcamera software-isp on RaspberryPi 3/4
hardware. The post is intended for the curious, to test out the SoftISP and
perhaps hack on it, on a relatively easy-to-grab hardware platform.
The Software-ISP in libcamera
SoftISP in itself, is quite an independent project in libcamera itself.
Currently, the ISP module merged in libcamera mainline, runs on CPU but
efforts are in full-swing to develop and merge a GPU-based Software ISP in
libcamera [1].
Ideally, you can use SoftwareISP on any platform by just adding the platform
matching string, in the list of supportedDevices of simple pipeline handler
and setting the SoftwareISP flag as true. We are doing to the same for RPi3/4,
in order to test it.
Add ‘unicam’ CSI-2 receiver for RPi 3/4 in the list of simple pipeline handler’s
list of supported devices. Additionally, set SoftwareISP flag to true, in order
to engage it.
We need to build libcamera now, without the Rpi3/4 pipeline handler but with
simple pipeline handler. One can specify this by passing -Dpipelines=simple
to meson.
The extensive build instructions are stated
here
.
Tip: You can pass --buildtype=release to meson for an perf-optimised build.
Test the build
Once a camera sensor is connected to RPi3/4 and libcamera has been build, one
can easily if the above configuration took effect and you are ready to
stream/route the frames from sensor to SoftwareISP.
($) ./build/src/apps/cam/cam --list
Now that you have verified that the camera pipeline is setup successfully, you
can be sure that the frames captured by the camera sensor are routed through
the SoftwareISP (instead of the bcm2835-isp present on RPi)
($) ./build/src/apps/cam/cam --camera 1 --capture
Tip: Pass one of --display, --sdl or --file=filename options to cam to direct
processed frames to one of the sinks.
Oops! Streaming failed?
Oh, well, it did happen to me when the RPi was connected to IMX219 sensor.
I happen to debug the issue and found that the simple pipeline handler does
not take into sensor transforms into the account during configure(). A patch
has been submitted
upstream
,
hopfully should land soon!
Still facing issues? Get in touch at the upstream IRC channel or libcamera
mailing list
.
Update on what happened in WebKit in the week from September 8 to September 15.
The JavaScriptCore implementation of Temporal continues to be polished,
as does SVGAElement, and WPE and WebKitGTK accessibility tests can now
run (but they are not passing yet).
Cross-Port 🐱
Add support for the hreflang attribute on SVGAElement, this helps to align it with HTMLAnchorElement.
An improvement in harnessing code for A11y tests allowed to unblock many tests marked as Timeout/Skip in WPEWebKit and WebKitGTK ports. These tests are not passing yet, but they are at least running now.
The built-in JavaScript/ECMAScript engine for WebKit, also known as JSC or SquirrelFish.
In the JavaScriptCore (JSC) implementation of Temporal, refactored the implementations of the difference operations (since and until) for the TemporalPlainTime type in order to match the spec. This enables further work on Temporal, which is being done incrementally.
What happened was, I wrote a bookmarklet in early 2024 that would load all of the comments on a lengthy GitHub issue by auto-clicking any “Load more” buttons in the page, and at some point between then and now GitHub changed their markup in a way that broke it, so I wrote a new one. Here it is:
It totals 258 characters of JavaScript, including the ISO-8601-style void marker, which is smaller than the old version. The old one looked for buttons, checked the .textContent of every single one to find any that said “Load more”, and dispatched a click to each of those. Then it would do that again until it couldn’t find any more such buttons. That worked great until GitHub’s markup got changed so that every button has at least three nested <div>s and <span>s inside itself, so now the button elements have no text content of their own. Why? Who knows. Probably something Copilot or Grok suggested.
So, for the new one provided above: when you invoke the bookmarklet, it waits half a second to look for an element on the page with a class value that starts with LoadMore-module__buttonChildrenWrapper. It then dispatches a bubbling click event to that element, waits two seconds, and then repeats the process. Once it repeats the process and finds no such elements, it terminates.
I still wish this capability was just provided by GitHub, and maybe if I keep writing about it I’ll manage to slip the idea into the training set of whatever vibe-coding resource hog they decide to add next. In the meantime, just drag the link above into your toolbar or otherwise bookmark it, use, and enjoy!
(And if they break it again, feel free to ping me by commenting here.)
perf is a tool you can use in Linux for analyzing performance-related issues. It has many features (e.g. it can report statistics on cache misses and set dynamic probes on kernel functions), but the one I’m concerned at this point is callchain sampling. That is, we can use perf as a sampling profiler.
A sampling profiler periodically inspects the stacktrace of the processes running in the CPUs at that time. During the sampling tick, it will record what function is currently runnig, what function called it, and so on recursively.
Sampling profilers are a go-to tool for figuring out where time is spent when running code. Given enough samples you can draw a clear correlation between the number of samples a function was found and what percentage of time that function was in the stack. Furthermore, since callers and callees are also tracked, you can know what other function called this one and how much time was spent on other functions inside this one.
What is using perf like?
You can try this on your own system by running perf top -g where -g stands for “Enable call-graph recording”. perf top gives you real time information about where time is currently spent. Alternatively, you can also record a capture and then open it, for example.
perf record -g ./my-program  # or use -p PID to record an already running program
perf report
The percentage numbers represent total time spent in that function. You can show or hide the callees of each function by selecting it with the arrow keys and then pressing the + key. You can expect the main function to take a significant chunk of the samples (that is, the entire time the program is running), which is subdivided between its callees, some taking more time than others, forming a weighted tree.
For even more detail, perf also records the position of the Program Counter, making it possible to know how much time is spent on each instruction within a given function. You can do this by pressing enter and selecting “Annotate code”. The following is a real example:
perf automatically attempts to use the available debug information from the binary to associate machine instructions with source lines. It can also highlight jump targets making it easier to follow loops. By default the left column shows the estimated percentage of time within this function where the accompanying instruction was running (other options are available with --percent-type).
The above example is a 100% CPU usage bug found in WebKit caused by a faulty implementation of fprintf in glibc. We can see the looping clearly in the capture. It’s also possible to derive—albeit not visible in the fragment— that other instructions of the function did not appear in virtually any of the samples, confirming the loop never exits.
What do I need to use perf?
A way to traverse callchains efficiently in the target platform that is supported by perf.
Symbols for all functions in your call chains, even if they’re not exported, so that you can see their names instead of their pointers.
A build with optimizations that are at least similar to production.
If you want to track source lines: Your build should contain some debuginfo. The minimal level of debugging info (-g1 in gcc) is OK, and so is every level above.
The perf binary, both in the target machine and in the machine you want to see the results. They don’t have to be the same machine and they don’t need to use the same architecture.
If you use x86_64 or ARM64, you can expect this to work. You can stop reading and enjoy perf.
Things are not so happy in the ARM32 land. I have spent roughly a month troubleshooting, learning lots of miscellaneous internals, patching code all over the stack, and after all of that, finally I got it working, but it has certainly been a ride. The remaining parts of this series cover how I got there.
This won’t be a tutorial in the usual sense. While you could follow this series like a tutorial, the goal is to get a better understanding of all the pieces involved so you’re more prepared when you have to do similar troubleshooting.
Update on what happened in WebKit in the week from September 1 to September 8.
In this week's installment of the periodical, we have better spec compliance of
JavaScriptCore's implementation of Temporal, an improvement in how gamepad events
are handled, WPE WebKit now implements a helper class which allows test baselines
to be aligned with other ports, and finally, an update on recent work on Sysprof.
Cross-Port 🐱
Until now, unrecognized gamepads didn't emit button presses or axis move events if they didn't map to the standard mapping layout according to W3C (https://www.w3.org/TR/gamepad/#remapping). Now we ensure that unrecognized gamepads always map to the standard layout, so events are always emitted if a button is pressed or the axis is moved.
JavaScriptCore 🐟
The built-in JavaScript/ECMAScript engine for WebKit, also known as JSC or SquirrelFish.
In the JavaScriptCore (JSC) implementation of Temporal, the compare() method on Temporal durations was modified to follow the spec, which increases the precision with which comparisons are made. This is another step towards a full spec-compliant implementation of Temporal in JSC.
WPE WebKit 📟
Added a specific implementation for helper class ImageAdapter for WPE. This class allows to load image resources that until now were only shipped in WebKitGTK and other ports. This change has aligned many WPE specific test baselines with the rest of WebKit ports, which were now removed.
Community & Events 🤝
Sysprof has received a variety of new features, improvements, and bugfixes, as part of the integration with Webkit. We continued pushing this front in the past 6 months! A few highlights:
An important bug with counters was fixed, and further integration was added to WebKit
It is now possible to hide marks from the waterfall view
Further work on the remote inspector integration, wkrictl, was done
Last year the Webkit project started to integrate its tracing routines with Sysprof. Since then, the feedback I’ve received about it is that it was a pretty big improvement in the development of the engine! Yay.
People started using Sysprof to have insights about the internal states of Webkit, gather data on how long different operations took, and more. Eventually we started hitting some limitations in Sysprof, mostly in the UI itself, such as lack of correlational and visualization features.
Earlier this year a rather interesting enhancement in Sysprof was added: it is now possible to filter the callgraph based on marks. What it means in practice is, it’s now possible to get statistically relevant data about what’s being executed during specific operations of the app.
In parallel to WebKit, recently Mesa merged a patch that integrates Mesa’s tracing routines with Sysprof. This brought data from yet another layer of the stack, and it truly enriches the profiling we can do on apps. We now have marks from the DRM vblank event, the compositor, GTK rendering, WebKit, Mesa, back to GTK, back to the compositor, and finally the composited frame submitted to the kernel. A truly full stack view of everything.
So, what’s the catch here? Well, if you’re an attentive reader, you may have noticed that the marks counter went from this last year:
To this, in March 2025:
And now, we’re at this number:
I do not jest when I say that this is a significant number! I mean, just look at this screenshot of a full view of marks:
Naturally, this is pushing Sysprof to its limits! The app is starting to struggle to handle such massive amounts of data. Having so much data also starts introducing noise in the marks – sometimes, for example, you don’t care about the Mesa marks, or the WebKit marks, of the GLib marks.
Hiding Marks
The most straightforward and impactful improvement that could be done, in light of what was explained above, was adding a way to hide certain marks and groups.
Sysprof heavily uses GListModels, as is trendy in GTK4 apps, so marks, catalogs, and groups are all considered lists containing lists containing items. So it felt natural to wrap these items in a new object with a visible property, and filter by this property, pretty straightforward.
Except it was not
Turns out, the filtering infrastructure in GTK4 did not support monitoring items for property changes. After talking to GTK developers, I learned that this was just a missing feature that nobody got to implementing. Sounded like a great opportunity to enhance the toolkit!
It took some wrestling, but it worked, the reviews were fantastic and now GtkFilterListModel has a new watch-items property. It only works when the the filter supports monitoring, so unfortunately GtkCustomFilter doesn’t work here. The implementation is not exactly perfect, so further enhancements are always appreciated.
So behold! Sysprof can now filter marks out of the waterfall view:
Counters
Another area where we have lots of potential is counters. Sysprof supports tracking variables over time. This is super useful when you want to monitor, for example, CPU usage, I/O, network, and more.
Naturally, WebKit has quite a number of internal counters that would be lovely to have in Sysprof to do proper integrated analysis. So between last year and this year, that’s what I’ve worked on as well! Have a look:
Unfortunately it took a long time to land some of these contributions, because Sysprof seemed to be behaving erratically with counters. After months fighting with it, I eventually figured out what was going on with the counters, and wrote the patch with probably my biggest commit message this year (beat only by few others, including a literal poem.)
Wkrictl
WebKit also has a remote inspector, which has stats on JavaScript objects and whatnot. It needs to be enabled at build time, but it’s super useful when testing on embedded devices.
I’ve started working on a way to extract this data from the remote inspector, and stuff this data into Sysprof as marks and counters. It’s called wkrict. Have a look:
This is far from finished, but I hope to be able to integrate this when it’s more concrete and well developed.
Future Improvements
Over the course of an year, the WebKit project went from nothing to deep integration with Sysprof, and more recently this evolved into actual tooling built around this integration. This is awesome, and has helped my colleagues and other contributors to contribute to the project in ways it simply wasn’t possible before.
There’s still *a lot* of work to do though, and it’s often the kind of work that will benefit everyone using Sysprof, not only WebKit. Here are a few examples:
Integrate JITDump symbol resolution, which allows profiling the JavaScript running on webpages. There’s ongoing work on this, but needs to be finished.
Per-PID marks and counters. Turns out, WebKit uses a multi-process architecture, so it would be better to redesign the marks and counters views to organize things by PID first, then groups, then catalogs.
A new timeline view. This is strictly speaking a condensed waterfall view, but it makes it more obvious the relationship between “inner” and “outer” marks.
Performance tuning in Sysprof and GTK. We’re dealing with orders of magnitude more data than we used to, and the app is starting to struggle to keep up with it.
Some of these tasks involve new user interfaces, so it would be absolutely lovely if Sysprof could get some design love from the design team. If anyone from the design team is reading this, we’d love to have your help
Finally, after all this Sysprof work, Christian kindly offered me to help co-maintain the project, which I accepted. I don’t know how much time and energy I’ll be able to dedicate, but I’ll try and help however I can!
I’d like to thank Christian Hergert, Benjamin Otte, and Matthias Clasen for all the code reviews, for all the discussions and patience during the influx of patches.
This article is a continuation of the series on damage propagation. While the previous article laid some foundation on the subject, this one
discusses the cost (increased CPU and memory utilization) that the feature incurs, as this is highly dependent on design decisions and the implementation of the data structure used for storing damage information.
From the perspective of this article, the two key things worth remembering from the previous one are:
The damage propagation is an optional WPE/GTK WebKit feature that — when enabled — reduces the browser’s GPU utilization at the expense of increased CPU and memory utilization.
On the implementation level, the damage is almost always a collection of rectangles that cover the changed region.
As mentioned in the section about damage of the previous article,
the damage information describes a region that changed and requires repainting. It was also pointed out that such a description is usually done via a collection of rectangles. Although sometimes
it’s better to describe a region in a different way, the rectangles are a natural choice due to the very nature of the damage in the web engines that originates from the box model.
A more detailed description of the damage nature can be inferred from the Pipeline details section of the
previous article. The bottom line is, in the end, the visual changes to the render tree yield the damage information in the form of rectangles.
For the sake of clarity, such original rectangles may be referred to as raw damage.
In practice, the above means that it doesn’t matter whether, e.g. the circle is drawn on a 2D canvas or the background color of some block element changes — ultimately, the rectangles (raw damage) are always produced
in the process.
As the raw damage is a collection of rectangles describing a damaged region, the geometrical consequence is that there may be more than one set of rectangles describing the same region.
It means that raw damage could be stored by a different set of rectangles and still precisely describe the original damaged region — e.g. when raw damage contains more rectangles than necessary.
The example of different approximations of a simple raw damage is depicted in the image below:
Changing the set of rectangles that describes the damaged region may be very tempting — especially when the size of the set could be reduced. However, the following consequences must be taken into account:
The damaged region could shrink when some damaging information would be lost e.g. if too many rectangles would be removed.
The damaged region could expand when some damaging information would be added e.g. if too many or too big rectangles would be added.
The first consequence may lead to visual glitches when repainting. The second one, however, causes no visual issues but degrades performance since a larger area
(i.e. more pixels) must be repainted — typically increasing GPU usage. This means the damage information can be approximated as long as the trade-off between the extra repainted area and the degree of simplification
in the underlying set of rectangles is acceptable.
The approximation mentioned above means the situation where the approximated damaged region covers the original damaged region entirely i.e. not a single pixel of information is lost. In that sense, the
approximation can only add extra information. Naturally, the lower the extra area added to the original damaged region, the better.
The approximation quality can be referred to as damage resolution, which is:
low — when the extra area added to the original damaged region is significant,
high — when the extra area added to the original damaged region is small.
The examples of low (left) and high (right) damage resolutions are presented in the image below:
Given the description of the damage properties presented in the sections above, it’s evident there’s a certain degree of flexibility when it comes to processing damage information. Such a situation is very fortunate in the
context of storing the damage, as it gives some freedom in designing a proper data structure. However, before jumping into the actual solutions, it’s necessary to understand the problem end-to-end.
layer damage — the damage tracked separately for each layer,
frame damage — the damage that aggregates individual layer damages and consists of the final damage of a given frame.
Assuming there are L layers and there is some data structure called Damage that can store the damage information, it’s easy to notice that there may be L+1 instances
of Damage present at the same time in the pipeline as the browser engine requires:
L Damage objects for storing layer damage,
1 Damage object for storing frame damage.
As there may be a lot of layers in more complex web pages, the L+1 mentioned above may be a very big number.
The first consequence of the above is that the Damage data structure in general should store the damage information in a very compact way to avoid excessive memory usage when L+1 Damage objects
are present at the same time.
The second consequence of the above is that the Damage data structure in general should be very performant as each of L+1 Damage objects may be involved into a considerable amount of processing when there are
lots of updates across the web page (and hence huge numbers of damage rectangles).
To better understand the above consequences, it’s essential to examine the input and the output of such a hypothetical Damage data structure more thoroughly.
The Damage becomes an input of other Damage in some situations, happening in the middle of the damage propagation pipeline when the broader damage is being assembled from smaller chunks of damage. What it consists
of depends purely on the Damage implementation.
The raw damage, on the other hand, becomes an input of the Damage always at the very beginning of the damage propagation pipeline. In practice, it consists of a set of rectangles that are potentially overlapping, duplicated, or empty. Moreover,
such a set is always as big as the set of changes causing visual impact. Therefore, in the worst case scenario such as drawing on a 2D canvas, the number of rectangles may be enormous.
Given the above, it’s clear that the hypothetical Damage data structure should support 2 distinct input operations in the most performant way possible:
When it comes to the Damage data structure output, there are 2 possibilities either:
other Damage,
the platform API.
The Damage becomes the output of other Damage on each Damage-to-Damage append that was described in the subsection above.
The platform API, on the other hand, becomes the output of Damage at the very end of the pipeline e.g. when the platform API consumes the frame damage (as described in the
pipeline details section of the previous article).
In this situation, what’s expected on the output technically depends on the particular platform API. However, in practice, all platforms supporting damage propagation require a set of rectangles that describe the damaged region.
Such a set of rectangles is fed into the platforms via APIs by simply iterating the rectangles describing the damaged region and transforming them to whatever data structure the particular API expects.
The natural consequence of the above is that the hypothetical Damage data structure should support the following output operation — also in the most performant way possible:
Given all the above perspectives, the problem of designing the Damage data structure can be summarized as storing the input damage information to be accessed (iterated) later in a way that:
the performance of operations for adding and iterating rectangles is maximal (performance),
the memory footprint of the data structure is minimal (memory footprint),
the stored region covers the original region and has the area as close to it as possible (damage resolution).
With the problem formulated this way, it’s obvious that this is a multi-criteria optimization problem with 3 criteria:
Given the problem of storing damage defined as above, it’s possible to propose various ways of solving it by implementing a Damage data structure. Before diving into details, however, it’s important to emphasize
that the weights of criteria may be different depending on the situation. Therefore, before deciding how to design the Damage data structure, one should consider the following questions:
What is the proportion between the power of GPU and CPU in the devices I’m targeting?
What are the memory constraints of the devices I’m targeting?
What are the cache sizes on the devices I’m targeting?
What is the balance between GPU and CPU usage in the applications I’m going to optimize for?
Are they more rendering-oriented (e.g. using WebGL, Canvas 2D, animations etc.)?
Are they more computing-oriented (frequent layouts, a lot of JavaScript processing etc.)?
Although answering the above usually points into the direction of specific implementation, usually the answers are unknown and hence the implementation should be as generic as possible. In practice,
it means the implementation should not optimize with a strong focus on just one criterion. However, as there’s no silver bullet solution, it’s worth exploring multiple, quasi-generic solutions that have been researched as
part of Igalia’s work on the damage propagation, and which are the following:
Damage storing all input rects,
Bounding box Damage,
Damage using WebKit’s Region,
R-Tree Damage,
Grid-based Damage.
All of the above implementations are being evaluated along the 3 criteria the following way:
Performance
by specifying the time complexity of add(Rectangle) operation as add(Damage) can be transformed into the series of add(Rectangle) operations,
by specifying the time complexity of forEachRectangle(...) operation.
Memory footprint
by specifying the space complexity of Damage data structure.
The most natural — yet very naive — Damage implementation is one that wraps a simple collection (such as vector) of rectangles and hence stores the raw damage in the original form.
In that case, the evaluation is as simple as evaluating the underlying data structure.
Assuming a vector data structure and O(1) amortized time complexity of insertion, the evaluation of such a Damage implementation is:
Performance
insertion is O(1) ✅
iteration is O(N) ❌
Memory footprint
O(N) ❌
Damage resolution
perfect ✅
Despite being trivial to implement, this approach is heavily skewed towards the damage resolution criterion. Essentially, the damage quality is the best possible, yet the expense is a very poor
performance and substantial memory footprint. It’s because a number of input rects N can be a very big number, thus making the linear complexities unacceptable.
The other problem with this solution is that it performs no filtering and hence may store a lot of redundant rectangles. While the empty rectangles can be filtered out in O(1),
filtering out duplicates and some of the overlaps (one rectangle completely containing the other) would make insertion O(N). Naturally, such a filtering
would lead to a smaller memory footprint and faster iteration in practice, however, their complexities would not change.
The second simplest Damage implementation one can possibly imagine is the implementation that stores just a single rectangle, which is a minimum bounding rectangle (bounding box) of all the damage
rectangles that were added into the data structure. The minimum bounding rectangle — as the name suggests — is a minimal rectangle that can fit all the input rectangles inside. This is well demonstrated in the picture below:
As this implementation stores just a single rectangle, and as the operation of taking the bounding box of two rectangles is O(1), the evaluation is as follows:
Performance
insertion is O(1) ✅
iteration is O(1) ✅
Memory footprint
O(1) ✅
Damage resolution
usually low ⚠️
Contrary to the Damage storing all input rects, this solution yields a perfect performance and memory footprint at the expense of low damage resolution. However,
in practice, the damage resolution of this solution is not always low. More specifically:
in the optimistic cases (raw damage clustered), the area of the bounding box is close to the area of the raw damage inside,
in the average cases, the approximation of the damaged region suffers from covering significant areas that were not damaged,
in the worst cases (small damage rectangles on the other ends of a viewport diagonal), the approximation is very poor, and it may be as bad as covering the whole viewport.
As this solution requires a minimal overhead while still providing a relatively useful damage approximation, in practice, it is a baseline solution used in:
Chromium,
Firefox,
WPE and GTK WebKit when UnifyDamagedRegions runtime preference is enabled, which means it’s used in GTK WebKit by default.
When it comes to more sophisticated Damage implementations, the simplest approach in case of WebKit is to wrap data structure already implemented in WebCore called
Region. Its purpose
is just as the name suggests — to store a region. More specifically, it’s meant to store rectangles describing region in an efficient way both for storage and for access to take advantage
of scanline coherence during rasterization. The key characteristic of the data structure is that it stores rectangles without overlaps. This is achieved by storing y-sorted lists of x-sorted, non-overlapping
rectangles. Another important property is that due to the specific internal representation, the number of integers stored per rectangle is usually smaller than 4. Also, there are some other useful properties
that are, however, not very useful in the context of storing the damage. More details on the data structure itself can be found in the J. E. Steinhart’s paper from 1991 titled
SCANLINE COHERENT SHAPE ALGEBRA
published as part of Graphics Gems II book.
The Damage implementation being a wrapper of the Region was actually used by GTK and WPE ports as a first version of more sophisticated Damage alternative for the bounding box Damage. Just as expected,
it provided better damage resolution in some cases, however, it suffered from effectively degrading to a more expensive variant bounding box Damage in the majority of situations.
The above was inevitable as the implementation was falling back to bounding box Damage when the Region’s internal representation was getting too complex. In essence, it was addressing the Region’s biggest problem,
which is that it can effectively store N2 rectangles in the worst case due to the way it splits rectangles for storing purposes. More specifically, as the Region stores ledges
and spans, each insertion of a new rectangle may lead to splitting O(N) existing rectangles. Such a situation is depicted in the image below, where 3 rectangles are being split
into 9:
Putting the above fallback mechanism aside, the evaluation of Damage being a simple wrapper on top of Region is the following:
Performance
insertion is O(logN) ✅
iteration is O(N2) ❌
Memory footprint
O(N2) ❌
Damage resolution
perfect ✅
Adding a fallback, the evaluation is technically the same as bounding box Damage for N above the fallback point, yet with extra overhead. At the same time, for smaller N, the above evaluation
didn’t really matter much as in such case all the performance, memory footprint, and the damage resolution were very good.
Despite this solution (with a fallback) yielded very good results for some simple scenarios (when N was small enough), it was not sustainable in the long run, as it was not addressing the majority of use cases,
where it was actually a bit slower than bounding box Damage while the results were similar.
In the pursuit of more sophisticated Damage implementations, one can think of wrapping/adapting data structures similar to quadtrees, KD-trees etc. However, in most of such cases, a lot of unnecessary overhead is added
as the data structures partition the space so that, in the end, the input is stored without overlaps. As overlaps are not necessarily a problem for storing damage information, the list of candidate data structures
can be narrowed down to the most performant data structures allowing overlaps. One of the most interesting of such options is the R-Tree.
In short, R-Tree (rectangle tree) is a tree data structure that allows storing multiple entries (rectangles) in a single node. While the leaf nodes of such a tree store the original
rectangles inserted into the data structure, each of the intermediate nodes stores the bounding box (minimum bounding rectangle, MBR) of the children nodes. As the tree is balanced, the above means that with every next
tree level from the top, the list of rectangles (either bounding boxes or original ones) gets bigger and more detailed. The example of the R-tree is depicted in the Figure 5 from
the Object Trajectory Analysis in Video Indexing and Retrieval Applications paper:
The above perfectly shows the differences between the rectangles on various levels and can also visually suggest some ideas when it comes to adapting such a data structure into Damage:
The first possibility is to make Damage a simple wrapper of R-Tree that would just build the tree and allow the Damage consumer to pick the desired damage resolution on iteration attempt. Such an approach is possible
as having the full R-Tree allows the iteration code to limit iteration to a certain level of the tree or to various levels from separate branches. The latter allows Damage to offer a particularly interesting API where the
forEachRectangle(...) function could accept a parameter specifying how many rectangles (at most) are expected to be iterated.
The other possibility is to make Damage an adaptation of R-Tree that conditionally prunes the tree while constructing it not to let it grow too much, yet to maintain a certain height and hence certain damage quality.
Regardless of the approach, the R-Tree construction also allows one to implement a simple filtering mechanism that eliminates input rectangles being duplicated or contained by existing rectangles on the fly. However,
such a filtering is not very effective as it can only consider a limited set of rectangles i.e. the ones encountered during traversal required by insertion.
Damage as a simple R-Tree wrapper
Although this option may be considered very interesting, in practice, storing all the input rectangles in the R-Tree means storing N rectangles along with the overhead of a tree structure. In the worst case scenario
(node size of 2), the number of nodes in the tree may be as big as O(N), thus adding a lot of overhead required to maintain the tree structure. This fact alone makes this solution have an
unacceptable memory footprint. The other problem with this idea is that in practice,
the damage resolution selection is usually done once — during browser startup. Therefore, the ability to select damage resolution during runtime brings no benefits while introduces unnecessary overhead.
The evaluation of the above is the following:
Performance
insertion is O(logMN) where M is the node size ✅
iteration is O(K) where K is a parameter and 0≤K≤N ✅
Memory footprint
O(N) ❌
Damage resolution
low to high ✅
Damage as an R-Tree adaptation with pruning
Considering the problems the previous idea has, the option with pruning seems to be addressing all the problems:
the memory footprint can be controlled by specifying at which level of the tree the pruning should happen,
the damage resolution (level of the tree where pruning happens) can be picked on the implementation level (compile time), thus allowing some extra implementation tricks if necessary.
While it’s true the above problems are not existing within this approach, the option with pruning — unfortunately — brings new problems that need to be considered. As a matter of fact, all the new problems it brings
are originating from the fact that each pruning operation leads to the loss of information and hence to the tree deterioration over time.
Before actually introducing those new problems, it’s worth understanding more about how insertions work in the R-Tree.
When the rectangle is inserted to the R-Tree, the first step is to find a proper position for the new record (see ChooseLeaf algorithm from Guttman1984). When the target node is
found, there are two possibilities:
adding the new rectangle to the target node does not cause overflow,
adding the new rectangle to the target node causes overflow.
If no overflow happens, the new rectangle is just added to the target node. However, if overflow happens i.e. the number of rectangles in the node exceeds the limit, the node splitting algorithm is invoked (see SplitNode
algorithm from Guttman1984) and the changes are being propagated up the tree (see ChooseLeaf algorithm from Guttman1984).
The node splitting, along with adjusting the tree, are very important steps within insertion as those algorithms are the ones that are responsible for shaping and balancing the tree. For example, when all the nodes in the tree are
full and the new rectangle is being added, the node splitting will effectively be executed for some leaf node and all its ancestors, including root. It means that the tree will grow and possibly, its structure will change significantly.
Due to the above mechanics of R-Tree, it can be reasonably asserted that the tree structure becomes better as a function of node splits. With that, the first problem of the tree pruning becomes obvious:
tree pruning on insertion limits the amount of node splits (due to smaller node splits cascades) and hence limits the quality of the tree structure. The second problem — also related to node splits — is that
with all the information lost due to pruning (as pruning is the same as removing a subtree and inserting its bounding box into the tree) each node split is less effective as the leaf rectangles themselves are
getting bigger and bigger due to them becoming bounding boxes of bounding boxes (…) of the original rectangles.
The above problems become more visible in practice when the R-tree input rectangles tend to be sorted. In general, one of the R-Tree problems is that its structure tends to be biased when the input rectangles are sorted.
Despite the further insertions usually fix the structure of the biased tree, it’s only done to some degree, as some tree nodes may not get split anymore. When the pruning happens and the input is sorted (or partially sorted)
the fixing of the biased tree is much harder and sometimes even impossible. It can be well explained with the example where a lot of rectangles from the same area are inserted into the tree. With the number of such rectangles
being big enough, a lot of pruning will happen and hence a lot of rectangles will be lost and replaced by larger bounding boxes. Then, if a series of new insertions will start inserting nodes from a different area which is
partially close to the original one, the new rectangles may end up being siblings of those large bounding boxes instead of the original rectangles that could be clustered within nodes in a much more reasonable way.
Given the above problems, the evaluation of the whole idea of Damage being the adaptation of R-Tree with pruning is the following:
Performance
insertion is O(logMK) where M is the node size, K is a parameter, and 0<K≤N ✅
iteration is O(K) ✅
Memory footprint
O(K) ✅
Damage resolution
low to medium ⚠️
Despite the above evaluation looks reasonable, in practice, it’s very hard to pick the proper pruning strategy. When the tree is allowed to be taller, the damage resolution is usually better, but the increased memory footprint,
logarithmic insertions, and increased iteration time combined pose a significant problem. On the other hand, when the tree is shorter, the damage resolution tends to be low enough not to justify using R-Tree.
The last, more sophisticated Damage implementation, uses some ideas from R-Tree and forms a very strict, flat structure. In short, the idea is to take some rectangular part of a plane and divide it into cells,
thus forming a grid with C columns and R rows. Given such a division, each cell of the grid is meant to store at most one rectangle that effectively is a bounding box of the rectangles matched to
that cell. The overview of the approach is presented in the image below:
As the above situation is very straightforward, one may wonder what would happen if the rectangle would span multiple cells i.e. how the matching algorithm would work in that case.
Before diving into the matching, it’s important to note that from the algorithmic perspective, the matching is very important as it accounts for the majority of operations during new rectangle insertion into the Damage data structure.
It’s because when the matched cell is known, the remaining part of insertion is just about taking the bounding box of existing rectangle stored in the cell and the new rectangle, thus having
O(1) time complexity.
As for the matching itself, it can be done in various ways:
it can be done using strategies known from R-Tree, such as matching a new rectangle into the cell where the bounding box enlargement would be the smallest etc.,
it can be done by maximizing the overlap between the new rectangle and the given cell,
it can be done by matching the new rectangle’s center (or corner) into the proper cell,
etc.
The above matching strategies fall into 2 categories:
O(CR) matching algorithms that compare a new rectangle against existing cells while looking for the best match,
O(1) matching algorithms that calculate the target cell using a single formula.
Due to the nature of matching, the O(CR) strategies eventually lead to smaller bounding boxes stored in the Damage and hence to better damage resolution as compared to the
O(1) algorithms. However, as the practical experiments show, the difference in damage resolution is not big enough to justify O(CR)
time complexity over O(1). More specifically, the difference in damage resolution is usually unnoticeable, while the difference between
O(CR) and O(1) insertion complexity is major, as the insertion is the most critical operation of the Damage data structure.
Due to the above, the matching method that has proven to be the most practical is matching the new rectangle’s center into the proper cell. It has O(1) time complexity
as it requires just a few arithmetic operations to calculate the center of the incoming rectangle and to match it to the proper cell (see
the implementation in WebKit). The example of such matching is presented in the image below:
The overall evaluation of the grid-based Damage constructed the way described in the above paragraphs is as follows:
performance
insertion is O(1) ✅
iteration is O(CR) ✅
memory footprint
O(CR) ✅
damage resolution
low to high (depending on the CR) ✅
Clearly, the fundamentals of the grid-based Damage are strong, but the data structure is heavily dependent on the CR. The good news is that, in practice, even a fairly small grid such as 8x4
(CR=32)
yields a damage resolution that is high. It means that this Damage implementation is a great alternative to bounding box Damage as even with very small performance and memory footprint overhead,
it yields much better damage resolution.
Moreover, the grid-based Damage implementation gives an opportunity for very handy optimizations that improve memory footprint, performance (iteration), and damage resolution further.
As the grid dimensions are given a-priori, one can imagine that intrinsically, the data structure needs to allocate a fixed-size array of rectangles with CR entries to store cell bounding boxes.
One possibility for improvement in such a situation (assuming small CR) is to use a vector along with bitset so that only non-empty cells are stored in the vector.
The other possibility (again, assuming small CR) is to not use a grid-based approach at all as long as the number of rectangles inserted so far does not exceed CR.
In other words, the data structure can allocate an empty vector of rectangles upon initialization and then just append new rectangles to the vector as long as the insertion does not extend the vector beyond
CR entries. In such a case, when CR is e.g. 32, up to 32 rectangles can be stored in the original form. If at some point the data structure detects that it would need to
store 33 rectangles, it switches internally to a grid-based approach, thus always storing at most 32 rectangles for cells. Also, note that in such a case, the first improvement possibility (with bitset) can still be used.
Summarizing the above, both improvements can be combined and they allow the data structure to have a limited, small memory footprint, good performance, and perfect damage resolution as long as there
are not too many damage rectangles. And if the number of input rectangles exceeds the limit, the data structure can still fall-back to a grid-based approach and maintain very good results. In practice, the situations
where the input damage rectangles are not exceeding CR (e.g. 32) are very common, and hence the above improvements are very important.
Overall, the grid-based approach with the above improvements has proven to be the best solution for all the embedded devices tried so far, and therefore, such a Damage implementation is a baseline solution used in
WPE and GTK WebKit when UnifyDamagedRegions runtime preference is not enabled — which means it works by default in WPE WebKit.
The former sections demonstrated various approaches to implementing the Damage data structure meant to store damage information. The summary of the results is presented in the table below:
While all the solutions have various pros and cons, the Bounding box and Grid-basedDamage implementations are the most lightweight and hence are most useful in generic use cases.
On typical embedded devices — where CPUs are quite powerful compared to GPUs — both above solutions are acceptable, so the final choice can be determined based on the actual use case. If the actual web application
often yields clustered damage information, the Bounding boxDamage implementation should be preferred. Otherwise (majority of use cases), the Grid-basedDamage implementation will work better.
On the other hand, on desktop-class devices – where CPUs are far less powerful than GPUs – the only acceptable solution is Bounding boxDamage as it has a minimal overhead while it sill provides some
decent damage resolution.
The above are the reasons for the default Damage implementations used by desktop-oriented GTK WebKit port (Bounding boxDamage) and embedded-device-oriented WPE WebKit (Grid-basedDamage).
When it comes to non-generic situations such as unusual hardware, specific applications etc. it’s always recommended to do a proper evaluation to determine which solution is the best fit. Also, the Damage implementations
other than the two mentioned above should not be ruled out, as in some exotic cases, they may give much better results.
In previous installments of this post series about Zephyr we
had
an initial
introduction to it, and then we went through
a basic
example application that showcased some of its features. If
you didn't read those, I heartily recommend you go through them
before continuing with this one. If you did already, welcome
back. In this post we'll see how to add support for a new device
in Zephyr.
As we've been doing so far, we'll use a Raspberry Pi Pico 2W
for our experiments. As of today (September 2nd, 2025), most of
the devices in the RP2350
SoC are
already supported,
but there
are still some peripherals that aren't. One of them is the
inter-processor mailbox that allows both ARM Cortex-M33
cores1 to communicate
and synchronize with each other. This opens some interesting
possibilities, since the SoC contains two cores but only one is
supported in Zephyr due to the architectural characteristics of
this type of SoC2. It'd
be nice to be able to use that second core for other things: a
bare-metal application, a second Zephyr instance or something
else, and the way to start the second core involves the use of
the inter-processor mailbox.
Throughout the post we will reference our main source material
for this task:
the RP2350
datasheet, so make sure to keep it at hand.
The inter-processor mailbox peripheral
The processor subsystem block in the RP2350 contains a
Single-cycle IO subsystem (SIO) that defines a set of
peripherals that require low-latency and deterministic access
from the processors. One of these peripherals is a pair of
inter-processor FIFOs that allow passing data, messages or
events between the two cores (section 3.1.5 in [1]).
The implementation and programmer's model for these is very
simple:
A mailbox is a pair of FIFOs that are 32 bits wide and
four entries deep.
One of the FIFOs can only be written by Core
0 and read by Core 1; the other can only be written by Core 1
and read by Core 0.
The SIO block has an IRQ output for each core to notify the
core that it has received data in its FIFO. This interrupt
is mapped to the same IRQ number (25) on each core.
A core can write to its outgoing FIFO as long as it's
not full.
That's basically it3. The mailbox writing, reading, setup
and status check are done through an also simple register
interface that's thoroughly described in sections 3.1.5 and
3.1.11 of the datasheet.
The typical use case scenario of this peripheral may be an
application distributed in two different computing entities (one
in each core) cooperating and communicating with each other: one
core running the main application logic in an OS while the other
performs computations triggered and specified by the former. For
instance, a modem/bridge device that runs the PHY logic in one
core and a bridge loop in the other as a bare metal program,
piping packets between network interfaces and a shared
memory. The mailbox is one of the peripherals that make it
possible for these independent cores to talk to each other.
But, as I mentioned earlier, in the RP2350 the mailbox has
another key use case: after reset, Core 1 remains asleep until
woken by Core 0. The process to wake up and run Core 1 involves
both cores going through a state machine coordinated by passing
messages over the mailbox (see [1], section 5.3).
Zephyr has more than one API that fits this type of hardware:
there's
the MBOX
interface, which models a generic multi-channel mailbox that
can be used for signalling and messaging, and
the IPM
interface, which seems a bit more specific and higher-level,
in the sense that it provides an API that's further away from
the hardware. For this particular case, our driver could use
either of these, but, as an exercise, I'm choosing to use the
generic MBOX interface, which we can then use as a backend for
the zephyr,mbox-ipm
driver (a thin IPM API wrapper over an MBOX driver) so we
can use the peripheral with the IPM API for free. This is also a
simple example of driver composition.
The MBOX API defines functions to send a message, configure
the device and check its status, register a callback handler for
incoming messages and get the number of channels. That's
what we need to implement, but first let's start with the basic
foundation for the driver: defining the hardware.
Hardware definition
As we know, Zephyr uses device tree definitions extensively
to configure the hardware and to query hardware details and
parameters from the drivers, so the first thing we'll do is to
model the peripheral
into the
device tree of the SoC.
In this case, the mailbox peripheral is part of the SIO
block, which isn't defined in the device tree, so we'll start by
adding this block as a placeholder for the mailbox and leave it
there in case anyone needs to add support for any of the other
SIO peripherals in the future. We only need to define its
address range mapping according to the info in the datasheet:
We also need to define a minimal device tree binding for it,
which can be extended later as needed
(dts/bindings/misc/raspberry,pico-sio.yaml):
description: Raspberry Pi Pico SIO

compatible: "raspberrypi,pico-sio"

include: base.yaml
Now we can define the mailbox as a peripheral inside the SIO
block. We'll create a device tree binding for it that will be
based on
the mailbox-controller
binding and that we can extend as needed. To define the
mailbox device, we only need to specify the IRQ number it
uses, a name for the interrupt and the number of "items"
(channels) to expect in a mailbox specifier, ie. when we
reference the device in another part of the device tree through
a phandle. In this case we won't need any channel
specification, since a CPU core only handles one mailbox
channel:
description: Raspberry Pi Pico interprocessor mailbox

compatible: "raspberrypi,pico-mbox"

include: [base.yaml, mailbox-controller.yaml]

properties:
  fifo-depth:
    type: int
    description: number of entries that the mailbox FIFO can hold
    required: true
Driver set up and code
Now that we have defined the hardware in the device tree, we
can start writing the driver. We'll put the source code next to
the rest of the mailbox drivers,
in drivers/mbox/mbox_rpi_pico.c, and we'll create a
Kconfig file for it (drivers/mbox/Kconfig.rpi_pico)
to define a custom config option that will let us enable or
disable the driver in our firmware build:
config MBOX_RPI_PICO
	bool "Inter-processor mailbox driver for the RP2350/RP2040 SoCs"
	default y
	depends on DT_HAS_RASPBERRYPI_PICO_MBOX_ENABLED
	help
	  Raspberry Pi Pico mailbox driver based on the RP2350/RP2040
	  inter-processor FIFOs.
Now, to make the build system aware of our driver, we need to
add it to the appropriate CMakeLists.txt file
(drivers/mbox/CMakeLists.txt):
Finally, we're ready to write the driver. The work here can
basically be divided into three parts: the driver structure setup
according to the MBOX API, the scaffolding needed to have our
driver correctly plugged into the device tree definitions by the
build system (according to
the Zephyr
device model), and the actual interfacing with the
hardware. We'll skip over most of the hardware-specific details,
though, and focus on the driver structure.
First, we will create a device object using one of the macros
of
the Device
Model API. There are many ways to do this, but, in rough
terms, what these macros do is to create the object from a
device tree node identifier and set it up for boot time
initialization. As part of the object attributes, we provide
things like an init function, a pointer to the device's private
data if needed, the device initialization level and a pointer to
the device's API structure. It's fairly common to
use DEVICE_DT_INST_DEFINE()
for this and loop over the different instances of the device in
the SoC with a macro
like DT_INST_FOREACH_STATUS_OKAY(),
so we'll use it here as well, even if we have only one instance
to initialize:
The init function, rpi_pico_mbox_init(),
referenced in the DEVICE_DT_INST_DEFINE() macro
call above, simply needs to set the device in a known state and
initialize the interrupt handler appropriately (but we're not
enabling interrupts yet):
#define MAILBOX_DEV_NAME mbox0

static int rpi_pico_mbox_init(const struct device *dev)
{
	ARG_UNUSED(dev);

	LOG_DBG("Initial FIFO status: 0x%x", sio_hw->fifo_st);
	LOG_DBG("FIFO depth: %d", DT_INST_PROP(0, fifo_depth));

	/* Disable the device interrupt. */
	irq_disable(DT_INST_IRQ_BY_NAME(0, MAILBOX_DEV_NAME, irq));

	/* Set the device in a stable state. */
	fifo_drain();
	fifo_clear_status();
	LOG_DBG("FIFO status after setup: 0x%x", sio_hw->fifo_st);

	/* Initialize the interrupt handler. */
	IRQ_CONNECT(DT_INST_IRQ_BY_NAME(0, MAILBOX_DEV_NAME, irq),
		DT_INST_IRQ_BY_NAME(0, MAILBOX_DEV_NAME, priority),
		rpi_pico_mbox_isr, DEVICE_DT_INST_GET(0), 0);

	return 0;
}
Where rpi_pico_mbox_isr() is the interrupt
handler.
The implementation of the MBOX API functions is really
simple. For the send function, we need to check
that the FIFO isn't full, that the message to send has the
appropriate size and then write it in the FIFO:
Note that the API lets us pass a channel
parameter to the call, but we don't need it.
The mtu_get and max_channels_get
calls are trivial: for the first one we simply need to return
the maximum message size we can write to the FIFO (4 bytes), for
the second we'll always return 1 channel:
#define MAILBOX_MBOX_SIZE sizeof(uint32_t)

static int rpi_pico_mbox_mtu_get(const struct device *dev)
{
	ARG_UNUSED(dev);

	return MAILBOX_MBOX_SIZE;
}

static uint32_t rpi_pico_mbox_max_channels_get(const struct device *dev)
{
	ARG_UNUSED(dev);

	/* Only one channel per CPU supported. */
	return 1;
}
The function to implement the set_enabled call
will just enable or disable the mailbox interrupt depending on
a parameter:
Finally, the function for the register_callback
call will store a pointer to a callback function for processing
incoming messages in the device's private data struct:
Once interrupts are enabled, the interrupt handler will call
that callback every time this core receives anything from the
other one:
static void rpi_pico_mbox_isr(const struct device *dev)
{
	struct rpi_pico_mailbox_data *data = dev->data;

	/*
	 * Ignore the interrupt if it was triggered by anything that's
	 * not a FIFO receive event.
	 *
	 * NOTE: the interrupt seems to be triggered when it's first
	 * enabled even when the FIFO is empty.
	 */
	if (!fifo_read_valid()) {
		LOG_DBG("Interrupt received on empty FIFO: ignored.");
		return;
	}

	if (data->cb != NULL) {
		uint32_t d = sio_hw->fifo_rd;
		struct mbox_msg msg = {
			.data = &d,
			.size = sizeof(d)};
		data->cb(dev, 0, data->user_data, &msg);
	}
	fifo_drain();
}
The fifo_*() functions scattered over the code
are helper functions that access the memory-mapped device
registers. This is, of course, completely
hardware-specific. For example:
/*
 * Returns true if the read FIFO has data available, ie. sent by the
 * other core. Returns false otherwise.
 */
static inline bool fifo_read_valid(void)
{
	return sio_hw->fifo_st & SIO_FIFO_ST_VLD_BITS;
}

/*
 * Discard any data in the read FIFO.
 */
static inline void fifo_drain(void)
{
	while (fifo_read_valid()) {
		(void)sio_hw->fifo_rd;
	}
}
Done, we should now be able to build and use the driver
if we enable the CONFIG_MBOX config option in our
firmware build.
Using the driver as an IPM backend
As I mentioned earlier, Zephyr provides a more convenient API
for inter-processor messaging based on this type of
devices. Fortunately, one of the drivers that implement that API
is a generic wrapper over an MBOX API driver like this one, so we
can use our driver as a backend for
the zephyr,mbox-ipm driver simply by adding a new
device to the device tree:
This defines an IPM device that takes two existing mailbox channels
and uses them for receiving and sending data. Note that, since
our mailbox only has one channel from the point of view of each
core, both "rx" and "tx" channels point to the same mailbox,
which implements the send and receive primitives appropriately.
Testing the driver
If we did everything right, now we should be able to signal
events and send data from one core to another. That'd require
both cores to be running, and, at boot time, only Core 0 is. So
let's see if we can get Core 1 to run, which is, in fact, the
most basic test of the mailbox we can do.
To do that in the easiest way possible, we can go back to the
most basic sample program there is,
the blinky
sample program, which, in this board, should print a periodic
message through the UART:
*** Booting Zephyr OS build v4.2.0-1643-g31c9e2ca8903 ***
LED state: OFF
LED state: ON
LED state: OFF
LED state: ON
...
To wake up Core 1, we need to send a sequence of inputs from
Core 0 using the mailbox and check at each step in the sequence
that Core 1 received and acknowledged the data by sending it
back. The data we need to send is (all 4-byte words):
0.
0.
1.
A pointer to the vector table for Core 1.
Core 1 stack pointer.
Core 1 initial program counter (ie. a pointer to its entry function).
in that order.
To send the data from Core 0 we need to instantiate an IPM
device, which we'll define in the device-tree first as an alias
for the IPM node we created before:
/ {
	chosen {
		zephyr,ipc = &ipc;
	};
Once we enable the IPM driver in the firmware configuration
(CONFIG_IPM=y), we can use the device like
this:
static const struct device *const ipm_handle =
	DEVICE_DT_GET(DT_CHOSEN(zephyr_ipc));

int main(void)
{
	...

	if (!device_is_ready(ipm_handle)) {
		printf("IPM device is not ready\n");
		return 0;
	}
To send data we use ipm_send(), to receive data
we'll register a callback that will be called every time Core 1
sends anything. In order to process the sequence handshake one
step at a time we can use a message queue to send the received
data from the IPM callback to the main thread:
The last elements to add are the actual Core 1 code, as well
as its stack and vector table. For the code, we can use a basic
infinite loop that will send a message to Core 0 every now and
then:
static inline void busy_wait(int loops)
{
	int i;

	for (i = 0; i < loops; i++)
		__asm__ volatile("nop");
}

#include <hardware/structs/sio.h>
static void core1_entry()
{
	int i = 0;

	while (1) {
		busy_wait(20000000);
		sio_hw->fifo_wr = i++;
	}
}
For the stack, we can just allocate a chunk of memory (it
won't be used anyway) and for the vector table we can do the
same and use an empty dummy table (because it won't be used
either):
So, finally we can build the example and check if Core 1
comes to life:
west build -p always -b rpi_pico2/rp2350a/m33 zephyr/samples/basic/blinky_two_cores
west flash -r uf2
Here's the UART output:
*** Booting Zephyr OS build v4.2.0-1643-g31c9e2ca8903 ***
Sending to Core 1: 0x0 (i = 0)
Message received from mbox 0: 0x0
Data received: 0x0
Sending to Core 1: 0x0 (i = 1)
Message received from mbox 0: 0x0
Data received: 0x0
Sending to Core 1: 0x1 (i = 2)
Message received from mbox 0: 0x1
Data received: 0x1
Sending to Core 1: 0x20000220 (i = 3)
Message received from mbox 0: 0x20000220
Data received: 0x20000220
Sending to Core 1: 0x200003f7 (i = 4)
Message received from mbox 0: 0x200003f7
Data received: 0x200003f7
Sending to Core 1: 0x10000905 (i = 5)
Message received from mbox 0: 0x10000905
Data received: 0x10000905
LED state: OFF
Message received from mbox 0: 0x0
LED state: ON
Message received from mbox 0: 0x1
Message received from mbox 0: 0x2
LED state: OFF
Message received from mbox 0: 0x3
Message received from mbox 0: 0x4
LED state: ON
Message received from mbox 0: 0x5
Message received from mbox 0: 0x6
LED state: OFF
Message received from mbox 0: 0x7
Message received from mbox 0: 0x8
That's it! We just added support for a new device and we
"unlocked" a new functionality for this board. I'll probably
take a break from Zephyr experiments for a while, so I don't
know if there'll be a part IV of this series anytime soon. In
any case, I hope you enjoyed it and found it useful. Happy
hacking!
1: Or both Hazard3 RISC-V cores, but we won't get
into that.↩
2: Zephyr supports SMP, but the ARM Cortex-M33
configuration in the RP2350 isn't built for symmetric
multi-processing. Both cores are independent and have no cache
coherence, for instance. Since these cores are meant for
small embedded devices rather than powerful computing
devices, the existence of multiple cores is meant to allow
different independent applications (or OSs) running in
parallel, cooperating and sharing the
hardware.↩
3: There's an additional instance of the mailbox
with its own interrupt as part of the non-secure SIO block
(see [1], section 3.1.1), but we won't get into that
either.↩
Update on what happened in WebKit in the week from August 25 to September 1.
The rewrite of the WebXR support continues, as do improvements
when building for Android, along with smaller fixes in multimedia
and standards compliance.
Cross-Port 🐱
The WebXR implementation has gained
input through OpenXR, including
support for the hand interaction—useful for devices which only support
hand-tracking—and the generic simple profile. This was soon followed by the
addition of support for the Hand
Input module.
Aligned the SVGStyleElement
type and media attributes with HTMLStyleElement's.
Multimedia 🎥
GStreamer-based multimedia support for WebKit, including (but not limited to) playback, capture, WebAudio, WebCodecs, and WebRTC.
Support for FFMpeg GStreamer audio decoders was
re-introduced
because the alternative decoders making use of FDK-AAC might not be available
in some distributions and Flatpak runtimes.
Graphics 🖼️
Usage of fences has been introduced
to control frame submission of rendered WebXR content when using OpenXR. This
approach avoids blocking in the renderer process waiting for frames to be
completed, resulting in slightly increased performance.
New, modern platform API that supersedes usage of libwpe and WPE backends.
Changed WPEPlatform to be built as part of the libWPEWebKit
library. This avoids duplicating some
code in different libraries, brings in a small reduction in used space, and
simplifies installation for packagers. Note that the wpe-platform-2.0 module
is still provided, and applications that consume the WPEPlatform API must still
check and use it.
Adaptation of WPE WebKit targeting the Android operating system.
Support for sharing AHardwareBuffer handles across processes is now
available. This lays out the
foundation to use graphics memory directly across different WebKit subsystems
later on, making some code paths more efficient, and paves the way towards
enabling the WPEPlatform API on Android.
One interesting aspect of FUSE user-space file systems is that caching can be
handled at the kernel level. For example, if an application reads data from a
file that happens to be on a FUSE file system, the kernel will keep that data in
the page cache so that later, if that data is requested again, it will be
readily available, without the need for the kernel to request it again to the
FUSE server. But the kernel also caches other file system data. For example,
it keeps track of metadata (file size, timestamps, etc) that may allow it to
also reply to a stat(2) system call without requesting it from user-space.
On the other hand, a FUSE server has a mechanism to ask the kernel to forget
everything related to an inode or to a dentry that the kernel already knows
about. This is a very useful mechanism, particularly for a networked file
system.
Imagine a network file system mounted in two different hosts, rocinante and
rucio. Both hosts will read data from the same file, and this data will be
cached locally. This is represented in the figure below, on the left. Now, if
that file is deleted from the rucio host (same figure, on the right),
rocinante will need to be notified about this deletion1. This is needed
so that the locally cached data in the rocinante host can also be remove. In
addition, if this is a FUSE file system, the FUSE server will need to ask the
kernel to forget everything about the deleted file.
Network File System Caching
Notifying the kernel to forget everything about a file system inode or
dentry can be easily done from a FUSE server using the
FUSE_NOTIFY_INVAL_INODE and FUSE_NOTIFY_INVAL_ENTRY operations. Or, if the
server is implemented using libfuse, by using the APIs
fuse_lowlevel_notify_inval_inode() and fuse_lowlevel_notify_entry(). Easy.
But what if the FUSE file system needs to notify the kernel to forget about
all the files in the file system? Well, the FUSE server would simply need to
walk through all those inodes and notify the kernel, one by one. Tedious
and time consuming. And most likely racy.
Asking the kernel to forget everything about all the files may sound like a odd
thing to do, but there are cases where this is needed. For example, the CernVM
File System does exactly this. This is a read-only file system, which was
developed to distribute software across virtual machines. Clients will then
mount the file system and cache data/meta-data locally. Changes to the file
system may happen only on a Release Manager Machine, a specific server where
the file system will be mounted in read/write mode. When this Release Manager
is done with all the changes, they can be all merged and published atomically,
as a new revision of the file system. Only then the clients are able to access
this new revision, but all the data (and meta-data) they have cached locally
will need to be invalidated.
And this is where a new mechanism that has just been merged into mainline kernel
v6.16 comes handy: a single operation that will ask the kernel to invalidate all
dentries for a specific FUSE connection that the kernel knows about. After
trying a few different approaches, I've implemented this mechanism for a project
at Igalia by adding the new FUSE_NOTIFY_INC_EPOCH operation. This operation
can be used from libfuse through
fuse_lowlevel_notify_increment_epoch()2.
In a nutshell, every dentry (or directory entry) can have a time-to-live
value associated with it; after this time has expired, it will need to be
revalidated. This revalidation will happen when the kernel VFS layer does a
file name look-up and finds a dentry cached (i.e. a dentry that has been
looked-up before).
Since this commit has been merged, the concept of epoch was introduced: a FUSE
server connection to the kernel will have an epoch value, and every new
dentry created will also have an epoch, initialised to the same value as the
connection. What the new FUSE_NOTIFY_INC_EPOCH operation will do is simply to
increment the connection epoch value. Later, when the VFS is performing a
look-up and finds a dentry cached, it will executed the FUSE callback function
to revalidate it. At this point, FUSE will verify that the dentryepoch
value is outdated and invalidate it.
Now, what's missing is an extra mechanism to periodically check for any
dentries that need to be invalidated so that invalid dentries don't hang
around for too long after the epoch is incremented. And that's exactly what's
currently under discussion upstream. Hopefully it will shortly get into a state
where it can be merged too.
Obviously, this is a very simplistic description – it all depends on the
actual file system design and implementation details, and specifically on the
communication protocol being used to synchronise the different servers/clients
across the network. In CephFS, for example, the clients get notified through
it's own Ceph-specific protocol, by having it's Metadata Servers (MDS) revoking
'capabilities' that have been previously given to the clients, forcing them to
request the data again if needed.
In this post I’m going to analyze the impact this feature will have on the IPFS ecosystem and how a specific need in a niche area has become a mechanism to fund the web. Let’s start with a brief introduction of the feature and why it is important for the web platform.
Ed25519 key pairs have become a standard in many web applications, and the IPFS protocol adopted them as the default some time ago. From the outset, Ed25519 public keys have also served as primary identifiers in systems like dat/hypercore and SSB. Projects within this technology ecosystem tend to favor Ed25519 keys due to their smaller size and the potential for faster cryptographic operations compared to RSA keys.
In the context of Web Applications, the browser is responsible for dealing with the establishment of a secure connection to a remote server, which necessarily entails signature verification. There are two possible approaches for application developers:
using the browser’s native cryptographic primitives, via the Web Cryptography API
bundling crypto libraries into the application itself (eg as JS source files or WebAssembly binaries).
Developers have often faced a difficult choice between using RSA keys, which are natively supported in browsers, and the Ed25519 keys they generally prefer, since using the latter required relying on external libraries until M137. These external software components introduce potential security risks if compromised, for which the developer and the application could be held responsible. In most cases, it’s desirable for private keys to be non-extractable in order to prevent attacks from malicious scripts or browser extensions, something that cannot be guaranteed with JS/WASM-based implementations that “bundle in” cryptography capabilities. Additionally, “user-space” implementations like these are necessarily vulnerable to supply chain attacks out of the developer’s control, further increasing the risk and liability surface.
The work Igalia has been doing in recent years to contribute to the implementation of the Curve25519-based algorithms in the 3 main browsers (Chrome, Firefox and Safari) made it possible to promote Ed25519 and X25519 from the Web Incubation Group to the official W3C Web Cryptography API specification. This is a key milestone for the IPFS development community, since it guarantees a stable API to native cryptography primitives in the browser, allowing simpler, more secure, and more robust applications. Additionally, not having to bundle in cryptography means less code to maintain and fewer surfaces to secure over time.
Impact the entire Web Platform – and that’s a huge win
As already mentioned, Secure Curves like Ed25519 and X25519 play an important role in the cryptographic related logic of dApps. However, what makes this project particularly interesting is that it targets the commons – the Web Platform itself. The effort to fund and implement a key advantage for a niche area has the potential to positively impact the entire Web Platform – and that’s a huge win.
There are several projects that will benefit from a native implementation of the Curve25519 algorithms in the browser’s Web Cryptography API.
Proton services
Proton offers services like Proton Mail, Proton Drive, Proton Calendar and Proton Wallet which use Elliptic Curve Cryptography (ECC) based on Curve25519 by default. Their web applications make use of the browser’s Web Cryptography API when available. The work we have done to implement and ship the Ed25519 and X25519 algorithms in the 3 main browser engines allows users of these services to rely on the browser’s native implementation of their choice, leading to improved performance and security. It’s worth mentioning that Proton is also contributing to the Web Cryptography API via the work Daniel Huigens is doing as spec editor
Matrix/Riot
The Matrix instant messaging web application uses Ed25519 for its device identity and cryptographic signing operations. These are implemented by the matrix-sdk-crypto Rust component, which is shared by both the web and native clients. This unified crypto engine is compiled to WebAssembly and integrated into the web client via the JavaScript SDK. Although theoretically, the web client could eventually use the browser’s Web Crypto API to implement the Ed25519-related operations, it might not be the right approach for now. The messaging app also requires other low-level cryptographic primitives that are not yet available in the Web API. Continued evolution of the Web Crypto API, with more algorithms and low level operations, is a key factor in increasing adoption of the API.
Signal
The Signal Protocol is well known for its robust end-to-end encrypted messaging capabilities, and the use of Ed25519 and X25519 is an important piece of its security model. The Signal web client, which is implemented as an Electron application, is based on the Signal Protocol, which relies on these algorithms. The cryptographic layer is implemented in the libsignal internal component, and it is used by all Signal clients. The point is that, as an Electron app, the web client may be able to take advantage of Chrome’s Web Crypto API; however, as with the Matrix web client, the specific requirement of these messaging applications, along with some limitations of the Web API, might be reasons to rule out this approach for the time being.
Use of Ed25519 and X25519 in the IPFS ecosystem
Developing web features implies a considerable effort in terms of time and money. Contributing to a better and more complete Web Platform is an admirable goal, but it does not justify the investment if it does not address a specific need. In this section I’m going to analyze the impact of this feature in some projects in the IPFS ecosystem.
Libp2p
According to the spec, implementations MUST support Ed25519. The js-libp2p implementation for the JS APIs exposed by the browser provides a libp2p-crypto library that depends on the WebCrypto API, so it doesn’t require building third-party crypto components. The upstream work to replace the Ed25519 operations with Web Crypto alternatives has also shown benefits in terms of performance; see the PR 3100 for details. Backward compatibility with the JavaScript based implementation, provided via @noble/curves, is guaranteed though.
There are several projects that depend on libp2p that would benefit from the use of the Web Cryptography API to implement their Ed25519 operations:
Hellia –a pure JavaScript implementation of the IPFS protocol capable of running in a browser or a Node.js server.
Peergos — a decentralised protocol and open-source platform for storage, social media and applications.
Lodestar – an Ethereum consensus client written in JS/TypeScript.
HOPR – a privacy-preserving network protocol for messaging.
Peerbit – a decentralized database framework with built-in encryption.
Topology – a decentralized network infrastructure tooling suite.
Helia
The Secure Curves are widely implemented in the main JavaScript engines, so now that the main browsers offer support in their stable releases, Helia developers can be fairly confident in relying on the Web Cryptography API implementation. The eventual removal of the @noble/curves dependency to implement the Ed25519 operations is going to positively impact the Helia project, for the reasons already explained. However, Helia depends on @libp2p/webrtc for the implementation of the WebRTC transport layer. This package depends on @peculiar/x509, probably for the X509 certificate creation and verification, and also on @peculiar/webcrypto. The latter is a WebCrypto API polyfill that probably would be worth removing, given that most of the JS engines already provide a native implementation.
Lodestar
This project heavily depends on js-libp2p to implement its real-time peer-to-peer network stack (Discv5, GossipSub, Resk/Resq and Noise). Its modular design enables it to operate as a decentralized Ethereum client for the libp2p applications ecosystem. It’s a good example because it doesn’t use Ed25519 for the implementation of its node identity; instead it’s based on secp256k1. However, Lodestar’s libp2p-based handshake uses the Noise protocol, which itself uses X25519 (Curve25519) for the Diffie–Hellman key exchange to establish a secure channel between peers. The Web Cryptography API provides operations for this key-sharing algorithm, and it has also been shipped in the stable releases of the 3 main browsers.
Peergos
This is an interesting example; unlike Hellia, it’s implemented in Java so it uses a custom libp2p implementation (in Java) built around jvm-libp2p, a native Java libp2p stack, and integrates cryptographic primitives on the JVM. It uses the Ed25519 operations for key generation, signatures, and identity purposes, but provides its own implementation as part of its cryptographic layer. Back in July 2024 they integrated a WebCryptoAPI based implementation, so that it’s used when supported in the browser. As a technology targeting the Web Platform, it’d be an interesting move to eventually get rid of the custom Ed25519 implementation and rely on the browser’s Web Cryptography API instead, either through the libp2p-crypto component or its own cryptographic layer.
Other decentralized technologies
The implementation of the Curve25519 related algorithms in the browser’s Web Cryptography API has had an impact that goes beyond the IPFS community, as it has been widely used in many other technologies across the decentralized web.
In this section I’m going to describe a few examples of relevant projects that are – or could potentially be – getting rid of third-party libraries to implement their Ed25519 and X25519 operations, relying on the native implementation provided by the browser.
Phantom wallet
Phantom was built specifically for Solana and designed to interact with Solana-based applications. Solana uses Ed25519 keys for identity and transaction signing, so Phantom generates and manages these keys within the browser or mobile device. This ensures that all operations (signing, message verification, address derivation) conform to Solana’s cryptographic standards. This integration comes from the official Solana JavaScript SDK: @solana/web3.js. In recent versions of the SDK, the Ed25519 operations use the native Crypto API if it is available, but it still provides a polyfill implemented with @noble/ed25519. According to the npm registry, the polyfill has a bundle size of 405 kB unpacked (minimized around 100 – 150 kB).
Making the Case for the WebCrypto API
In the previous sections we have discussed several web projects where the Ed25519 and X25519 algorithms are a fundamental piece of their cryptographic layer. The variety of solutions adopted to provide an implementation of the cryptographic primitives, such as those for identity and signing, has been remarkable.
@noble/curves – A high-security, easily auditable set of contained cryptographic libraries, Zero or minimal dependencies, highly readable TypeScript / JS code, PGP-signed releases and transparent NPM builds.
@solana/webcrypto-ed25519-polyfill – Provides a shim for Ed25519 crypto for the Solana SDK when the browser doesn’t support it natively.
@yoursunny/webcrypto-ed25519 – A lightweight polyfill or ponyfill (25 kB unpacked) for browsers lacking native Ed25519 support.
Custom SDK implementations
matrix-sdk-crypto – A no-network-IO implementation of a state machine that handles end-to-end encryption for Matrix clients. Compiled to WebAssembly and integrated into the web client via the JavaScript SDK.
Bouncy Castle Crypto – The Bouncy Castle Crypto package is a Java implementation of cryptographic algorithms.
libsignal – signal-crypto provides cryptographic primitives such as AES-GCM; it uses RustCrypto‘s where possible.
As mentioned before, some web apps have strong cross-platform requirements, or simply the Web Crypto API is not flexible enough or lacks support for new algorithms (eg, Matrix and Signal). However, for the projects where the Web Platform is a key use case, the Web API offers way more advantages in terms of performance, bundle size, security and stability.
The Web Crypto API is supported in the main JavaScript engines (Node.js, Deno) and the main web browsers (Safari, Chrome and Firefox). This full coverage of the Web Platform ensures high levels of interoperability and stability for both users and developers of web apps. Additionally, with the recent milestone announced in this post – the shipment of Secure Curves support in the latest stable Chrome release – the availability of this in the Web Platform is also remarkable:
Investment and prioritization
The work to implement and ship the Ed25519 and X25519 algorithms in the 3 main browser engines has been a long path. It took a few years to stabilize the WICG document, prototyping, increasing the test coverage in the WPT repository and incorporating both algorithms in the W3C official draft of the Web Cryptography API specification. Only after this final step, could the shipment procedure be finally completed, with Chrome 137 being the last one to ship the feature enabled by default.
This experience shows another example of a non-browser vendor pushing forward a feature that benefits the whole Web Platform, even if it initially covers a short-term need of a niche community, in this case the dWeb ecosystem. It’s also worth noting how the prioritization of this kind of web feature works in the Web Platform development cycle, and more specifically the browser feature shipment process. The browsers have their own budgets and priorities, and it’s the responsibility of the Web Platform consumers to invest in the features they consider critical for their user base. Without non-browser vendors pushing forward features, the Web Platform would evolve at a much slower pace.
The flaws of trying to use the Web Crypto API for some projects have been noted in this post, which prevent a bigger adoption of this API in favor of third-party cryptography components. The API needs to incorporate new algorithms, as has been recently discussed in the Web App Sec Working Group meetings; there is an issue to collect ideas for new algorithms and a WICG draft. Some of the proposed algorithms include post-quantum secure and modern cryptographic algorithms like ML-KEM, ML-DSA, and ChaChaPoly1305.
Recap and next steps
The Web Cryptography API specification has had a difficult journey in the last few years, as was explained in a previous post, when the Web Cryptography WG was dismantled. Browsers gave very low priority to this API until Daniel Huigens (Proton) took over the responsibility and became the only editor of the spec. The implementation progress has been almost exclusively targeting standalone JS engines until this project by Igalia was launched 3 years ago.
The incorporation of Ed25519 and X25519 into the official W3C draft, along with default support in all three major web browsers, has brought this feature to the forefront of web application development where a cryptographic layer is required.
The use of the Web API provides several advantages to the web authors:
Performance – Generally more performant implementation of the cryptographic operations, including reduced bundled size of the web app.
Security – Reduced attack surface, including JS timing attacks or memory disclosure via JS inspection; no supply-chain vulnerabilities.
Stability and Interoperability – Standardized and stable API, long-term maintenance by the browsers’ development teams.
Streams and WebCrypto
This is a “decade problem”, as it’s noticeable from the WebCrypto issue 73, which now has some fresh traction thanks to a recent proposal by WinterTC, a technical committee focused on web-interoperable server runtimes; there is also an alternate proposal from the WebCrypto WG. It’s still unclear how much support to expect from implementors, especially the three main browser vendors, but Chrome has at least expressed strong opposition to the idea of a streaming encryption / decryption. However, there is a clear indication of support for hashing of streams, which is perhaps the use case from which IPFS developers would benefit most. Streams would have a big impact on many IPFS related use cases, especially in combination with better support for BLAKE3 which would be a major step forward.
Update on what happened in WebKit in the week from August 18 to August 25.
This week continue improvements in the WebXR front, more layout tests passing,
support for CSS's generic font family for math, improvements in the graphics
stack, and an Igalia Chat episode!
The WebXR implementation has gained support to funnel usage permission requests through the public API for immersive sessions. Note that this is a basic implementation, and fine-grained control of requested session capabilities may be added at a later time.
The CSS font-family: math generic font family is now supported in WebKit. This is part of the CSS Fonts Level 4 specification.
The WebXR implementation has gained to ability to use GBM graphics buffers as fallback, which allows usage with drivers that do not provide the EGL_MESA_image_dma_buf_export extension, yet use GBM for buffer allocation.
Early this month, a new episode of Igalia Chat titled "Get Down With the WebKit" was released, where Brian Kardell and Eric Meyer talk with Igalia's Alejandro (Alex) Garcia about the WebKit project and Igalia's WPE port.
It’s uncommon, but not unheard of, for a GitHub issue to spark an uproar. That happened over the past month or so as the WHATWG (Web Hypertext Application Technology Working Group, which I still say should have called themselves a Task Force instead) issue “Should we remove XSLT from the web platform?” was opened, debated, and eventually locked once the comment thread started spiraling into personal attacks. Other discussions have since opened, such as a counterproposal to update XSLT in the web platform, thankfully with (thus far) much less heat.
If you’re new to the term, XSLT (Extensible Stylesheet Language Transformations) is an XML language that lets you transform one document tree structure into another. If you’ve ever heard of people styling their RSS and/or Atom feeds to look nice in the browser, they were using some amount of XSLT to turn the RSS/Atom into HTML, which they could then CSS into prettiness.
This is not the only use case for XSLT, not by a long shot, but it does illustrate the sort of thing XSLT is good for. So why remove it, and who got this flame train rolling in the first place?
Before I start, I want to note that in this post, I won’t be commenting on whether or not XSLT support should be dropped from browsers or not. I’m also not going to be systematically addressing the various reactions I’ve seen to all this. I have my own biases around this — some of them in direct conflict with each other! — but my focus here will be on what’s happened so far and what might lie ahead.
Also, Brian and I talked with Liam Quin about all this, if you’d rather hear a conversation than read a blog post.
As a very quick background, various people have proposed removing XSLT support from browsers a few times over the quarter-century-plus since support first landed. It was discussed in both the early and mid-2010s, for example. At this point, browsers all more or less support XSLT 1.0, whereas the latest version of XSLT is 3.0. I believe they all do so with C++ code, which is therefore not memory-safe, that is baked into the code base rather than supported via some kind of plugged-in library, like Firefox using PDF.js to support PDFs in the browser.
Anyway, back on August 1st, Mason Freed of Google opened issue #11523 on WHATWG’s HTML repository, asking if XSLT should be removed from browsers and giving a condensed set of reasons why it might be a good idea. He also included a WASM-based polyfill he’d written to provide XSLT support, should browsers remove it, and opened “ Investigate deprecation and removal of XSLT” in the Chromium bug tracker.
“So it’s already been decided and we just have to bend over and take the changes our Googlish overlords have decreed!” many people shouted. It’s not hard to see where they got that impression, given some of the things Google has done over the years, but that’s not what’s happening here. Not at this point. I’d like to set some records straight, as an outside observer of both Google and the issue itself.
First of all, while Mason was the one to open the issue, this was done because the idea was raised in a periodic WHATNOT meeting (call), where someone at Mozilla was actually the one to bring it up, after it had come up in various conversations over the previous few months. After Mason opened the issue, members of the Mozilla and WebKit teams expressed (tentative, mostly) support for the idea of exploring this removal. Basically, none of the vendors are particularly keen on keeping native XSLT support in their codebases, particularly after security flaws were found in XSLT implementations.
This isn’t the first time they’ve all agreed it might be nice to slim their codebases down a little by removing something that doesn’t get a lot of use (relatively speaking), and it won’t be the last. I bet they’ve all talked at some point about how nice it would be to remove BMP support.
Mason mentioned that they didn’t have resources to put toward updating their XSLT code, and got widely derided for it. “Google has trillions of dollars!” people hooted. Google has trillions of dollars. The Chrome team very much does not. They probably get, at best, a tiny fraction of one percent of those dollars. Whether Google should give the Chrome team more money is essentially irrelevant, because that’s not in the Chrome team’s control. They have what they have, in terms of head count and time, and have to decide how those entirely finite resources are best spent.
(I will once again invoke my late-1900s formulation of Hanlon’s Razor: Never attribute to malice that which can be more adequately explained by resource constraints.)
Second of all, the issue was opened to start a discussion and gather feedback as the first stage of a multi-step process, one that could easily run for years. Google, as I assume is true for other browser makers, has a pretty comprehensive method for working out whether removing a given feature is tenable or not. Brian and I talked with Rick Byers about it a while back, and I was impressed by both how many things have been removed, and what they do to make sure they’re removing the right things.
Here’s one (by no means the only!) way they could go about this:
Set up a switch that allows XSLT to be disabled.
In the next release of Chrome, use the switch to disable XSLT in one percent of all Chrome downloads.
See if any bug reports come in about it. If so, investigate further and adjust as necessary if the problems are not actually about XSLT.
If not, up the percentage of XSLT-disabled downloads a little bit at a time over a number of releases. If no bugs are reported as the percentage of XSLT-disabled users trends toward 100%, then prepare to remove it entirely.
If, on the other hand, it becomes clear that removing XSLT will be a widely breaking change — where “widely” can still mean a very tiny portion of their total user base — then XSLT can be re-enabled for all users as soon as possible, and the discussion taken back up with this new information in hand.
Again, that is just one of several approaches Google could take, and it’s a lot simpler than what they would most likely actually do, but it’s roughly what they default to, as I understand it. The process is slow and deliberate, building up a picture of actual use and user experience.
Third of all, opening a bug that includes a pull request of code changes isn’t a declaration of countdown to merge, it’s a way of making crystal clear (to those who can read the codebase) exactly what the proposal would entail. It’s basically a requirement for the process of making a decision to start, because it sets the exact parameters of what’s being decided on.
That said, as a result of all this, I now strongly believe that every proposed-removal issue should point to the process and where the issue stands in it. (And write down the process if it hasn’t been already.) This isn’t for the issue’s intended audience, which was other people within WHATWG who are familiar with the usual process and each other, but for cases of context escape, like happened here. If a removal discussion is going to be held in public, then it should assume the general public will see it and provide enough context for the general public to understand the actual nature of the discussion. In the absence of that context, the nature of the discussion will be assumed, and every assumption will be different.
There is one thing that we should all keep in mind, which is that “remove from the web platform” really means “remove from browsers”. Even if this proposal goes through, XSLT could still be used server-side. You could use libraries that support XSLT versions more recent than 1.0, even! Thus, XML could still be turned into HTML, just not in the client via native support, though JS or WASM polyfills, or even add-on extensions, would still be an option. Is that good or bad? Like everything else in our field, the answer is “it depends”.
Just in case your eyes glazed over and you quickly skimmed to see if there was a TL;DR, here it is:
The discussion was opened by a Google employee in response to interest from multiple browser vendors in removing built-in XSLT, following a process that is opaque to most outsiders. It’s a first step in a multi-step evaluation process that can take years to complete, and whose outcome is not predetermined. Tempers flared and the initial discussion was locked; the conversation continues elsewhere. There are good reasons to drop native XSLT support in browsers, and also good reasons to keep or update it, but XSLT is not itself at risk.
Previously on meyerweb, I explored ways to do strange things with the infinity keyword in CSS calculation functions. There were some great comments on that post, by the way; you should definitely go give them a read. Anyway, in this post, I’ll be doing the same thing, but with different properties!
When last we met, I’d just finished up messing with font sizes and line heights, and that made me think about other text properties that accept lengths, like those that indent text or increase the space between words and letters. You know, like these:
<div>I have some text and I cannot lie!</div>
<div>I have some text and I cannot lie!</div>
<div>I have some text and I cannot lie!</div>
According to Frederic Goudy, I am now the sort of man who would steal a infinite number of sheep. Which is untrue, because, I mean, where would I put them?
Consistency across Firefox, Chrome, and Safari
Visually, these all came to exactly the same result, textually speaking, with just very small (probably line-height-related) variances in element height. All get very large horizontal overflow scrolling, yet scrolling out to the end of that overflow reveals no letterforms at all; I assume they’re sat just offscreen when you reach the end of the scroll region. I particularly like how the “I” in the first <div> disappears because the first line has been indented a few million (or a few hundred undecillion) pixels, and then the rest of the text is wrapped onto the second line. And in the third <div>, we can check for line-leading steganography!
When you ask for the computed values, though, that’s when things get weird.
Text property results
Computed value for…
Browser
text-indent
word-spacing
letter-spacing
Safari
33554428px
33554428px
33554428px
Chrome
33554400px
3.40282e+38px
33554400px
Firefox (Nightly)
3.40282e+38px
3.40282e+38px
3.40282e+38px
Safari and Firefox are at least internally consistent, if many orders of magnitude apart from each other. Chrome… I don’t even know what to say. Maybe pick a lane?
I have to admit that by this point in my experimentation, I was getting a little bored of infinite pixel lengths. What about infinite unitless numbers, like line-height or — even better — z-index?
The result you get in any of Firefox, Chrome, or Safari
It turns out that in CSS you can go to infinity, but not beyond, because the computed values were the same regardless of whether the calc() value was infinity or infinity + 1.
z-index values
Browser
Computed value
Safari
2147483647
Chrome
2147483647
Firefox (Nightly)
2147483647
Thus, the first two <div> s were a long way above the third, but were themselves drawn with the later-painted <div> on top of the first. This is because in positioning, if overlapping elements have the same z-index value, the one that comes later in the DOM gets painted over top any that come before it.
This does also mean you can have a finite value beat infinity. If you change the previous CSS like so:
…then the third <div> is painted atop the other two, because they all have the same computed value. And no, increasing the finite value to a value equal to 2,147,483,648 or higher doesn’t change things, because the computed value of anything in that range is still 2147483647.
The results here led me to an assumption that browsers (or at least the coding languages used to write them) use a system where any “infinity” that has multiplication, addition, or subtraction done to it just returns “infinite”. So if you try to double Infinity, you get back Infinity (or Infinite or Inf or whatever symbol is being used to represent the concept of the infinite). Maybe that’s entry-level knowledge for your average computer science major, but I was only one of those briefly and I don’t think it was covered in the assembler course that convinced me to find another major.
Looking across all those years back to my time in university got me thinking about infinite spans of time, so I decided to see just how long I could get an animation to run.
div {
	animation-name: shift;
	animation-duration: calc(infinity * 1s);
}
@keyframes shift {
	from {
		transform: translateX(0px);
	}
	to {
		transform: translateX(100px);
	}
}
<div>I’m timely!</div>
The results were truly something to behold, at least in the cases where beholding was possible. Here’s what I got for the computed animation-duration value in each browser’s web inspector Computed Values tab or subtab:
animation-duration values
Browser
Computed value
As years
Safari
🤷🏽
Chrome
1.79769e+308s
5.7004376e+300
Firefox (Nightly)
3.40282e+38s
1.07902714e+31
Those are… very long durations. In Firefox, the <div> will finish the animation in just a tiny bit over ten nonillion (ten quadrillion quadrillion) years. That’s roughly ten times as long as it will take for nearly all the matter in the known Universe to have been swallowed by supermassive galactic black holes.
In Chrome, on the other hand, completing the animation will take approximately half again as long asan incomprehensibly longer amount of time than our current highest estimate for the amount of time it will take for all the protons and neutrons in the observable Universe to decay into radiation, assuming protons actually decay. (Source: Wikipedia’s Timeline of the far future.)
“Okay, but what about Safari?” you may be asking. Well, there’s no way as yet to find out, because while Safari loads and renders the page like usual, the page then becomes essentially unresponsive. Not the browser, just the page itself. This includes not redrawing or moving the scrollbar gutters when the window is resized, or showing useful information in the Web Inspector. I’ve already filed a bug, so hopefully one day we’ll find out whether its temporal limitations are the same as Chrome’s or not.
It should also be noted that it doesn’t matter whether you supply 1s or 1ms as the thing to multiply with infinity: you get the same result either way. This makes some sense, because any finite number times infinity is still infinity. Well, sort of. But also yes.
So what happens if you divide a finite amount by infinity? In browsers, you very consistently get nothing!
div {
	animation-name: shift;
	animation-duration: calc(100000000000000000000000s / infinity);
}
(Any finite number could be used there, so I decided to type 1 and then hold the 0 key for a second or two, and use the resulting large number.)
Division-by-infinity results
Browser
Computed value
Safari
0
Chrome
0
Firefox (Nightly)
0
Honestly, seeing that kind of cross-browser harmony… that was soothing.
And so we come full circle, from something that yielded consistent results to something else that yields consistent results. Sometimes, it’s the little wins that count the most.
Update on what happened in WebKit in the week from August 11 to August 18.
This week we saw updates in WebXR support, better support for changing audio outputs,
enabling of GLib API when building the JSCOnly port, improvements to damaging propagation,
WPE platform enhancements, and more!
GStreamer-based multimedia support for WebKit, including (but not limited to) playback, capture, WebAudio, WebCodecs, and WebRTC.
Changing audio outputs has been changed to use gst_device_reconfigure_element() instead of relying on knowledge about how different GStreamer sink elements handle the choice of output device. Note that audio output selection support is in development and disabled by default, the ExposeSpeakers, ExposeSpeakersWithoutMicrophone, and PerElementSpeakerSelection features flags may be toggled to test it.
Recently, I have been working on webkitgtk support for in-band text tracks in Media Source Extensions,
so far just for WebVTT in MP4. Eventually, I noticed a page that seemed to be
using a CEA-608 track - most likely unintentionally, not expecting it to be handled - so I decided
to take a look how that might work. Take a look at the resulting PR here: https://github.com/WebKit/WebKit/pull/47763
Now, if you’re not already familiar with subtitle and captioning formats, particularly CEA-608,
you might assume they must be straightforward, compared to audio and video. After all, its
just a bit of text and some timestamps, right?
However, even WebVTT as a text-based format already provides lots of un- or poorly supported features that
don’t mesh well with MSE - for details on those open questions, take a look at Alicia’s session on the topic:
https://github.com/w3c/breakouts-day-2025/issues/14
CEA-608, also known as line 21 captions, is responsible for encoding captions as a fixed-bitrate
stream of byte pairs in an analog NTSC broadcast. As the name suggests, they are transmitted during
the vertical blanking period, on line 21 (and line 284, for the second field) - imagine this as the
mostly blank area “above” the visible image. This provides space for up to 4 channels of captioning,
plus some additional metadata about the programming, though due to the very limited bandwidth, these
capabilities were rarely used to their full extent.
While digital broadcasts provide captioning defined by its successor standard CEA-708,
this newer format still provides the option to embed 608 byte pairs.
This is still quite common, and is enabled by later standards defining a digital encoding,
known as Caption Distribution Packets.
These are also what enables CEA-608 tracks in MP4.
The main issue I’ve encountered in trying to make CEA-608 work in an MSE context lies in its origin
as a fixed-bitrate stream - there is no concept of cues, no defined start or end, just one continuous stream.
As WebKit internally understands only WebVTT cues, we rely on GStreamer’s cea608tott element
for the conversion to WebVTT. Essentially, this element needs to create cues with well-defined timestamps,
which works well enough if we have the entire stream present on disk.
However, when 608 is present as a track in an MSE stream, how do we tell if the “current” cue
is continued in the next SourceBuffer? Currently, cea608tott will just wait for more data,
and emit another cue once it encounters a line break, or its current line buffer fills up,
but this also means the final cue will be swallowed, because there will never be “more data”
to allow for that decision.
The solution would be to always cut off cues at SourceBuffer boundaries, so cues might appear
to be split awkwardly to the viewer.
Overall, this conversion to VTT won’t reproduce the captions as they were intended to be viewed,
at least not currently. In particular, roll-up mode can’t easily be emulated using WebVTT.
The other issue is that I’ve assumed for the current patch that CEA-608 captions
will be present as a separate MP4 track, while in practice they’re usually injected
into the video stream, which will be harder to handle well.
Finally, there is the risk of breaking existing websites, that might have unintentionally
left CEA-608 captions in, and don’t handle a surprise duplicate text track well.
While this patch only provides experimental support so far, I feel this has given
me valuable insight into how inband text tracks can work with various formats aside from
just WebVTT. Ironically, CEA-608 even avoids some of WebVTT’s issues - there are no gaps or
overlapping cues to worry about, for example.
Either way, I’m looking forward to improving on WebVTT’s pain points,
and maybe adding other formats eventually!
In the first week of June (2025), our team at Igalia held our regular meeting about Chromium.
We talked about our technical projects, but also where the Chromium project is leading, given all the investments going to AI, and this interesting initiative from the Linux Foundation to fund open development of Chromium.
We also held our annual Igalia meeting, filled with many special moments — one of them being when Valerie, who had previously shared how Igalia is co-operatively managed, spoke about her personal journey and involvement with other cooperatives.
In
the previous
post we set up a Zephyr development environment and
checked that we could build applications for multiple
different targets. In this one we'll work on a sample
application that we can use to showcase a few Zephyr features
and as a template for other applications with a similar
workflow.
We'll simulate a real work scenario and develop a firmware
for a hardware board (in this example it'll be
a Raspberry
Pi Pico 2W) and we'll set up a development workflow that
supports the native_sim target, so we can do most
of the programming and software prototyping on a simulated
environment without having to rely on the
hardware.
When developing for new hardware, it's a common practice
that the software teams need to start working on firmware
and drivers before the hardware is available, so the initial
stages of software development for new silicon and boards is
often tested on software or hardware emulators.
Then, after the prototyping is done we can deploy and test the
firmare on the real board. We'll see how we can do a simple
behavioral model of some of the devices we'll use in the final
hardware setup and how we can leverage this workflow to
unit-test and refine the firmware.
This post is a walkthrough of the whole application. You can
find the code here.
Application description
The application we'll build and run on the Raspberry Pi Pico
2W will basically just listen for a button press. When the
button is pressed the app will enqueue some work to be done by
a processing thread and the result will be published via I2C
for a controller to request. At the same time, it will
configure two serial consoles, one for message logging and
another one for a command shell that can be used for testing
and debugging.
These are the main features we'll cover with this experiment:
Support for multiple targets.
Target-specific build and hardware configuration.
Logging.
Multiple console output.
Zephyr shell with custom commands.
Device emulation.
GPIO handling.
I2C target handling.
Thread synchronization and message-passing.
Deferred work (bottom halves).
Hardware setup
Besides the target board and the development machine, we'll
be using a Linux-based development board that we can use to
communicate with the Zephyr board via I2C. Anything will do
here, I used a very
old Raspberry
Pi Model B that I had lying around.
The only additional peripheral we'll need is a physical
button connected to a couple of board pins. If we don't have
any, a jumper cable and a steady pulse will also
work. Optionally, to take full advantage of the two serial
ports, a USB - TTL UART converter will be useful. Here's how the
full setup looks like:
For additional info on how to set up the Linux-based
Raspberry Pi, see the appendix at the
end.
Setting up the application files
Before we start coding we need to know how we'll structure
the application. There are certain conventions and file
structure that the build system expects to find under certain
scenarios. This is how we'll structure the application
(test_rpi):
Some of the files there we already know from
the previous
post: CMakeLists.txt
and prj.conf. All the application code will be in
the src directory, and we can structure it as we
want as long as we tell the build system about the files we
want to compile. For this application, the main code will be
in main.c, processing.c will contain
the code of the processing thread, and emul.c
will keep everything related to the device emulation for
the native_sim target and will be compiled only
when we build for that target. We describe this to the build
system through the contents of CMakeLists.txt:
In prj.conf we'll put the general Zephyr
configuration options for this application. Note that inside
the boards directory there are two additional
.conf files. These are target-specific options that will be
merged to the common ones in prj.conf depending
on the target we choose to build for.
Normally, most of the options we'll put in the .conf files
will be already defined, but we can also define
application-specific config options that we can later
reference in the .conf files and the code. We can define them
in the application-specific Kconfig file. The build system
will it pick up as the main Kconfig file if it exists. For
this application we'll define one additional config option
that we'll use to configure the log level for the program, so
this is how Kconfig will look like:
config TEST_RPI_LOG_LEVEL
	int "Default log level for test_rpi"
	default 4

source "Kconfig.zephyr"
Here we're simply prepending a config option before all
the rest of the main Zephyr Kconfig file. We'll see how to
use this option later.
Finally, the boards directory also contains
target-specific overlay files. These are regular device tree
overlays which are normally used to configure the
hardware. More about that in a while.
Main application architecture
The application flow is structured in two main threads: the
main
thread
and an additional processing thread that does its work
separately. The main thread runs the application entry point
(the main() function) and does all the software
and device set up. Normally it doesn't need to do anything
more, we can use it to start other threads and have them do
the rest of the work while the main thread sits idle, but in
this case we're doing some work with it instead of creating an
additional thread for that. Regarding the processing thread,
we can think of it as "application code" that runs on its
own and provides a simple interface to interact with the rest
of the system1.
Once the main thread has finished all the initialization
process (creating threads, setting up callbacks, configuring
devices, etc.) it sits in an infinite loop waiting for messages
in a message queue. These messages are sent by the processing
thread, which also runs in a loop waiting for messages in
another queue. The messages to the processing thread are sent, as
a result of a button press, by the GPIO ISR callback registered
(actually, by the bottom half triggered by it and run by a
workqueue
thread). Ignoring the I2C part for now, this is how the
application flow would look like:
Once the button press is detected, the GPIO ISR calls a
callback we registered in the main setup code. The callback
defers the work (1) through a workqueue (we'll see why later),
which sends some data to the processing thread (2). The data
it'll send is just an integer: the current uptime in
seconds. The processing thread will then do some processing
using that data (convert it to a string) and will send the
processed data to the main thread (3). Let's take a look at
the code that does all this.
Thread creation
As we mentioned, the main thread will be responsible for,
among other tasks, spawning other threads. In our example it
will create only one additional thread.
We'll see what the data_process() function does
in a while. For now, notice we're passing two message queues,
one for input and one for output, as parameters for that
function. These will be used as the interface to connect the
processing thread to the rest of the firmware.
GPIO handling
Zephyr's device tree support greatly simplifies device
handling and makes it really easy to parameterize and handle
device operations in an abstract way. In this example, we
define and reference the GPIO for the button in our setup
using a platform-independent device tree node:
This looks for a "button-gpios" property in
the "zephyr,user"
node in the device tree of the target platform and
initializes
a gpio_dt_spec
property containing the GPIO pin information defined in the
device tree. Note that this initialization and the check for
the "zephyr,user" node are static and happen at compile time
so, if the node isn't found, the error will be caught by the
build process.
This is how the node is defined for the Raspberry Pi Pico
2W:
This defines the GPIO to be used as the second GPIO from
bank
0, it'll be set up with an internal pull-up resistor and
will be active-low. See
the device
tree GPIO API for details on the specification format. In
the board, that GPIO is routed to pin 4:
Now we'll use
the GPIO
API to configure the GPIO as defined and to add a callback
that will run when the button is pressed:
if (!gpio_is_ready_dt(&button)) {
	LOG_ERR("Error: button device %s is not ready",
	       button.port->name);
	return 0;
}
ret = gpio_pin_configure_dt(&button, GPIO_INPUT);
if (ret != 0) {
	LOG_ERR("Error %d: failed to configure %s pin %d",
	       ret, button.port->name, button.pin);
	return 0;
}
ret = gpio_pin_interrupt_configure_dt(&button,
                                      GPIO_INT_EDGE_TO_ACTIVE);
if (ret != 0) {
	LOG_ERR("Error %d: failed to configure interrupt on %s pin %d",
		ret, button.port->name, button.pin);
	return 0;
}
gpio_init_callback(&button_cb_data, button_pressed, BIT(button.pin));
gpio_add_callback(button.port, &button_cb_data);
We're configuring the pin as an input and then we're enabling
interrupts for it when it goes to logical level "high". In
this case, since we defined it as active-low, the interrupt
will be triggered when the pin transitions from the stable
pulled-up voltage to ground.
Finally, we're initializing and adding a callback function
that will be called by the ISR when it detects that this GPIO
goes active. We'll use this callback to start an action from
a user event. The specific interrupt handling is done
by the target-specific device driver2 and we don't have to worry about
that, our code can remain device-independent.
NOTE: The callback we'll define is meant as
a simple exercise for illustrative purposes. Zephyr provides an
input
subsystem to handle cases
like this
properly.
What we want to do in the callback is to send a message to
the processing thread. The communication input channel to the
thread is the in_msgq message queue, and the data
we'll send is a simple 32-bit integer with the number of
uptime seconds. But before doing that, we'll first de-bounce
the button press using a simple idea: to schedule the message
delivery to a
workqueue
thread:
/*
 * Deferred irq work triggered by the GPIO IRQ callback
 * (button_pressed). This should run some time after the ISR, at which
 * point the button press should be stable after the initial bouncing.
 *
 * Checks the button status and sends the current system uptime in
 * seconds through in_msgq if the the button is still pressed.
 */
static void debounce_expired(struct k_work *work)
{
	unsigned int data = k_uptime_seconds();
	ARG_UNUSED(work);

	if (gpio_pin_get_dt(&button))
		k_msgq_put(&in_msgq, &data, K_NO_WAIT);
}

static K_WORK_DELAYABLE_DEFINE(debounce_work, debounce_expired);

/*
 * Callback function for the button GPIO IRQ.
 * De-bounces the button press by scheduling the processing into a
 * workqueue.
 */
void button_pressed(const struct device *dev, struct gpio_callback *cb,
		    uint32_t pins)
{
	k_work_reschedule(&debounce_work, K_MSEC(30));
}
That way, every unwanted oscillation will cause a
re-scheduling of the message delivery (replacing any prior
scheduling). debounce_expired will eventually
read the GPIO status and send the message.
Thread synchronization and messaging
As I mentioned earlier, the interface with the processing
thread consists on two message queues, one for input and one for
output. These are defined statically with
the K_MSGQ_DEFINE macro:
Both queues have space to hold only one message each. For the
input queue (the one we'll use to send messages to the
processing thread), each message will be one 32-bit
integer. The messages of the output queue (the one the
processing thread will use to send messages) are 8 bytes
long.
Once the main thread is done initializing everything, it'll
stay in an infinite loop waiting for messages from the
processing thread. The processing thread will also run a loop
waiting for incoming messages in the input queue, which are
sent by the button callback, as we saw earlier, so the message
queues will be used both for transferring data and for
synchronization. Since the code running in the processing
thread is so small, I'll paste it here in its entirety:
static char data_out[PROC_MSG_SIZE];

/*
 * Receives a message on the message queue passed in p1, does some
 * processing on the data received and sends a response on the message
 * queue passed in p2.
 */
void data_process(void *p1, void *p2, void *p3)
{
	struct k_msgq *inq = p1;
	struct k_msgq *outq = p2;
	ARG_UNUSED(p3);

	while (1) {
		unsigned int data;

		k_msgq_get(inq, &data, K_FOREVER);
		LOG_DBG("Received: %d", data);

		/* Data processing: convert integer to string */
		snprintf(data_out, sizeof(data_out), "%d", data);

		k_msgq_put(outq, data_out, K_NO_WAIT);
	}
}
I2C target implementation
Now that we have a way to interact with the program by
inputting an external event (a button press), we'll add a way
for it to communicate with the outside world: we're going to
turn our device into a
I2C target
that will listen for command requests from a controller and
send data back to it. In our setup, the controller will be
Linux-based Raspberry Pi, see the diagram in
the Hardware setup section above
for details on how the boards are connected.
In order to define an I2C target we first need a
suitable device defined in the device tree. To abstract the
actual target-dependent device, we'll define and use an alias
for it that we can redefine for every supported target. For
instance, for the Raspberry Pi Pico 2W we define this alias in
its device tree overlay:
So now in the code we can reference
the i2ctarget alias to load the device info and
initialize it:
/*
 * Get I2C device configuration from the devicetree i2ctarget alias.
 * Check node availability at buid time.
 */
#define I2C_NODE	DT_ALIAS(i2ctarget)
#if !DT_NODE_HAS_STATUS_OKAY(I2C_NODE)
#error "Unsupported board: i2ctarget devicetree alias is not defined"
#endif
const struct device *i2c_target = DEVICE_DT_GET(I2C_NODE);
To register the device as a target, we'll use
the i2c_target_register()
function, which takes the loaded device tree device and an
I2C target configuration (struct
i2c_target_config) containing the I2C
address we choose for it and a set of callbacks for all the
possible events. It's in these callbacks where we'll define the
target's functionality:
Each of those callbacks will be called as a response from an
event started by the controller. Depending on how we want to
define the target we'll need to code the callbacks to react
appropriately to the controller requests. For this application
we'll define a register that the controller can read to get a
timestamp (the firmware uptime in seconds) from the last time
the button was pressed. The number will be received as an
8-byte ASCII string.
If the controller is the Linux-based Raspberry Pi, we can use
the i2c-tools
to poll the target and read from it:
We basically want the device to react when the controller
sends a write request (to select the register and prepare the
data), when it sends a read request (to send the data bytes
back to the controller) and when it sends a stop
condition.
To handle the data to be sent, the I2C callback
functions manage an internal buffer that will hold the string
data to send to the controller, and we'll load this buffer
with the contents of a source buffer that's updated every time
the main thread receives data from the processing thread (a
double-buffer scheme). Then, when we program an I2C
transfer we walk this internal buffer sending each byte to the
controller as we receive read requests. When the transfer
finishes or is aborted, we reload the buffer and rewind it for
the next transfer:
typedef enum {
	I2C_REG_UPTIME,
	I2C_REG_NOT_SUPPORTED,

	I2C_REG_DEFAULT = I2C_REG_UPTIME
} i2c_register_t;

/* I2C data structures */
static char i2cbuffer[PROC_MSG_SIZE];
static int i2cidx = -1;
static i2c_register_t i2creg = I2C_REG_DEFAULT;

[...]

/*
 * Callback called on a write request from the controller.
 */
int write_requested_cb(struct i2c_target_config *config)
{
	LOG_DBG("I2C WRITE start");
	return 0;
}

/*
 * Callback called when a byte was received on an ongoing write request
 * from the controller.
 */
int write_received_cb(struct i2c_target_config *config, uint8_t val)
{
	LOG_DBG("I2C WRITE: 0x%02x", val);
	i2creg = val;
	if (val == I2C_REG_UPTIME)
		i2cidx = -1;

	return 0;
}

/*
 * Callback called on a read request from the controller.
 * If it's a first read, load the output buffer contents from the
 * current contents of the source data buffer (str_data).
 *
 * The data byte sent to the controller is pointed to by val.
 * Returns:
 *   0 if there's additional data to send
 *   -ENOMEM if the byte sent is the end of the data transfer
 *   -EIO if the selected register isn't supported
 */
int read_requested_cb(struct i2c_target_config *config, uint8_t *val)
{
	if (i2creg != I2C_REG_UPTIME)
		return -EIO;

	LOG_DBG("I2C READ started. i2cidx: %d", i2cidx);
	if (i2cidx < 0) {
		/* Copy source buffer to the i2c output buffer */
		k_mutex_lock(&str_data_mutex, K_FOREVER);
		strncpy(i2cbuffer, str_data, PROC_MSG_SIZE);
		k_mutex_unlock(&str_data_mutex);
	}
	i2cidx++;
	if (i2cidx == PROC_MSG_SIZE) {
		i2cidx = -1;
		return -ENOMEM;
	}
	*val = i2cbuffer[i2cidx];
	LOG_DBG("I2C READ send: 0x%02x", *val);

	return 0;
}

/*
 * Callback called on a continued read request from the
 * controller. We're implementing repeated start semantics, so this will
 * always return -ENOMEM to signal that a new START request is needed.
 */
int read_processed_cb(struct i2c_target_config *config, uint8_t *val)
{
	LOG_DBG("I2C READ continued");
	return -ENOMEM;
}

/*
 * Callback called on a stop request from the controller. Rewinds the
 * index of the i2c data buffer to prepare for the next send.
 */
int stop_cb(struct i2c_target_config *config)
{
	i2cidx = -1;
	LOG_DBG("I2C STOP");
	return 0;
}
The application logic is done at this point, and we were
careful to write it in a platform-agnostic way. As mentioned
earlier, all the target-specific details are abstracted away
by the device tree and the Zephyr APIs. Although we're
developing with a real deployment board in mind, it's very
useful to be able to develop and test using a behavioral model
of the hardware that we can program to behave as close to the
real hardware as we need and that we can run on our
development machine without the cost and restrictions of the
real hardware.
To do this, we'll rely on the native_sim board3, which implements the core OS
services on top of a POSIX compatibility layer, and we'll add
code to simulate the button press and the I2C
requests.
Emulating a button press
We'll use
the gpio_emul
driver as a base for our emulated
button. The native_sim device tree already defines
an emulated GPIO bank for this:
We'll model the button press as a four-phase event consisting
on an initial status change caused by the press, then a
semi-random rebound phase, then a phase of signal
stabilization after the rebounds stop, and finally a button
release. Using the gpio_emul API it'll look like
this:
/*
 * Emulates a button press with bouncing.
 */
static void button_press(void)
{
	const struct device *dev = device_get_binding(button.port->name);
	int n_bounces = sys_rand8_get() % 10;
	int state = 1;
	int i;

	/* Press */
	gpio_emul_input_set(dev, 0, state);
	/* Bouncing */
	for (i = 0; i < n_bounces; i++) {
		state = state ? 0: 1;
		k_busy_wait(1000 * (sys_rand8_get() % 10));
		gpio_emul_input_set(dev, 0, state);
	}
	/* Stabilization */
	gpio_emul_input_set(dev, 0, 1);
	k_busy_wait(100000);
	/* Release */
	gpio_emul_input_set(dev, 0, 0);
}
The driver will take care of checking if the state changes
need
to raise interrupts, depending on the GPIO configuration,
and will trigger the registered callback that we defined
earlier.
Emulating an I2C controller
As with the button emulator, we'll rely on an existing
emulated device driver for
this: i2c_emul. Again,
the device tree for the target already defines the node we
need:
So we can define a machine-independent alias that we can
reference in the code:
/ {
	aliases {
		i2ctarget = &i2c0;
	};
The events we need to emulate are the requests sent by the
controller: READ start, WRITE start and STOP. We can define
these based on
the i2c_transfer()
API function which will, in this case, use
the i2c_emul
driver implementation to simulate the transfer. As in the
GPIO emulation case, this will trigger the appropriate
callbacks. The implementation of our controller requests looks
like this:
/*
 * A real controller may want to continue reading after the first
 * received byte. We're implementing repeated-start semantics so we'll
 * only be sending one byte per transfer, but we need to allocate space
 * for an extra byte to process the possible additional read request.
 */
static uint8_t emul_read_buf[2];

/*
 * Emulates a single I2C READ START request from a controller.
 */
static uint8_t *i2c_emul_read(void)
{
	struct i2c_msg msg;
	int ret;

	msg.buf = emul_read_buf;
	msg.len = sizeof(emul_read_buf);
	msg.flags = I2C_MSG_RESTART | I2C_MSG_READ;
	ret = i2c_transfer(i2c_target, &msg, 1, I2C_ADDR);
	if (ret == -EIO)
		return NULL;

	return emul_read_buf;
}

static void i2c_emul_write(uint8_t *data, int len)
{
	struct i2c_msg msg;

	/*
	 * NOTE: It's not explicitly said anywhere that msg.buf can be
	 * NULL even if msg.len is 0. The behavior may be
	 * driver-specific and prone to change so we're being safe here
	 * by using a 1-byte buffer.
	 */
	msg.buf = data;
	msg.len = len;
	msg.flags = I2C_MSG_WRITE;
	i2c_transfer(i2c_target, &msg, 1, I2C_ADDR);
}

/*
 * Emulates an explicit I2C STOP sent from a controller.
 */
static void i2c_emul_stop(void)
{
	struct i2c_msg msg;
	uint8_t buf = 0;

	/*
	 * NOTE: It's not explicitly said anywhere that msg.buf can be
	 * NULL even if msg.len is 0. The behavior may be
	 * driver-specific and prone to change so we're being safe here
	 * by using a 1-byte buffer.
	 */
	msg.buf = &buf;
	msg.len = 0;
	msg.flags = I2C_MSG_WRITE | I2C_MSG_STOP;
	i2c_transfer(i2c_target, &msg, 1, I2C_ADDR);
}
Now we can define a complete request for an "uptime read"
operation in terms of these primitives:
/*
* Emulates an I2C "UPTIME" command request from a controller using
* repeated start.
*/
static void i2c_emul_uptime(const struct shell *sh, size_t argc, char **argv)
{
uint8_t buffer[PROC_MSG_SIZE] = {0};
i2c_register_t reg = I2C_REG_UPTIME;
int i;
i2c_emul_write((uint8_t *)®, 1);
for (i = 0; i < PROC_MSG_SIZE; i++) {
uint8_t *b = i2c_emul_read();
if (b == NULL)
break;
buffer[i] = *b;
}
i2c_emul_stop();
if (i == PROC_MSG_SIZE) {
shell_print(sh, "%s", buffer);
} else {
shell_print(sh, "Transfer error");
}
}
Ok, so now that we have implemented all the emulated
operations we needed, we need a way to trigger them on the
emulated
environment. The Zephyr
shell is tremendously useful for cases like this.
Shell commands
The shell module in Zephyr has a lot of useful features that
we can use for debugging. It's quite extensive and talking
about it in detail is out of the scope of this post, but I'll
show how simple it is to add a few custom commands to trigger
the button presses and the I2C controller requests
from a console. In fact, for our purposes, the whole thing is
as simple as this:
SHELL_CMD_REGISTER(buttonpress, NULL, "Simulates a button press", button_press);
SHELL_CMD_REGISTER(i2cread, NULL, "Simulates an I2C read request", i2c_emul_read);
SHELL_CMD_REGISTER(i2cuptime, NULL, "Simulates an I2C uptime request", i2c_emul_uptime);
SHELL_CMD_REGISTER(i2cstop, NULL, "Simulates an I2C stop request", i2c_emul_stop);
We'll enable these commands only when building for
the native_sim board. With the configuration
provided, once we run the application we'll have the log
output in stdout and the shell UART connected to a pseudotty,
so we can access it in a separate terminal and run these
commands while we see the output in the terminal where we ran
the application:
$ ./build/zephyr/zephyr.exe
WARNING: Using a test - not safe - entropy source
uart connected to pseudotty: /dev/pts/16
*** Booting Zephyr OS build v4.1.0-6569-gf4a0beb2b7b1 ***

# In another terminal
$ screen /dev/pts/16

uart:~$
uart:~$ help
Please press the <Tab> button to see all available commands.
You can also use the <Tab> button to prompt or auto-complete all commands or its subcommands.
You can try to call commands with <-h> or <--help> parameter for more information.

Shell supports following meta-keys:
  Ctrl + (a key from: abcdefklnpuw)
  Alt  + (a key from: bf)
Please refer to shell documentation for more details.

Available commands:
  buttonpress  : Simulates a button press
  clear        : Clear screen.
  device       : Device commands
  devmem       : Read/write physical memory
                 Usage:
                 Read memory at address with optional width:
                 devmem <address> [<width>]
                 Write memory at address with mandatory width and value:
                 devmem <address> <width> <value>
  help         : Prints the help message.
  history      : Command history.
  i2cread      : Simulates an I2C read request
  i2cstop      : Simulates an I2C stop request
  i2cuptime    : Simulates an I2C uptime request
  kernel       : Kernel commands
  rem          : Ignore lines beginning with 'rem '
  resize       : Console gets terminal screen size or assumes default in case
                 the readout fails. It must be executed after each terminal
                 width change to ensure correct text display.
  retval       : Print return value of most recent command
  shell        : Useful, not Unix-like shell commands.
To simulate a button press (ie. capture the current
uptime):
uart:~$ buttonpress
And the log output should print the enabled debug
messages:
This is the process I followed to set up a Linux system on a
Raspberry Pi (very old, model 1 B). There are plenty of
instructions for this on the Web, and you can probably just
pick up a pre-packaged and
pre-configured Raspberry
Pi OS and get done with it faster, so I'm adding this here
for completeness and because I want to have a finer grained
control of what I put into it.
The only harware requirement is an SD card with two
partitions: a small (~50MB) FAT32 boot partition and the rest
of the space for the rootfs partition, which I formatted as
ext4. The boot partition should contain a specific set of
configuration files and binary blobs, as well as the kernel
that we'll build and the appropriate device tree binary. See
the official
docs for more information on the boot partition contents
and this
repo for the binary blobs. For this board, the minimum
files needed are:
bootcode.bin: the second-stage bootloader, loaded by the
first-stage bootloader in the BCM2835 ROM. Run by the GPU.
start.elf: GPU firmware, starts the ARM CPU.
fixup.dat: needed by start.elf. Used to configure the SDRAM.
kernel.img: this is the kernel image we'll build.
dtb files and overlays.
And, optionally but very recommended:
config.txt: bootloader configuration.
cmdline.txt: kernel command-line parameters.
In practice, pretty much all Linux setups will also have
these files. For our case we'll need to add one additional
config entry to the config.txt file in order to
enable the I2C bus:
dtparam=i2c_arm=on
Once we have the boot partition populated with the basic
required files (minus the kernel and dtb files), the two main
ingredients we need to build now are the kernel image and the
root filesystem.
There's nothing non-standard about how we'll generate this
kernel image, so you can search the Web for references on how
the process works if you need to. The only things to take into
account is that we'll pick
the Raspberry
Pi kernel instead of a vanilla mainline kernel. I also
recommend getting the arm-linux-gnueabi
cross-toolchain
from kernel.org.
After installing the toolchain and cloning the repo, we just
have to run the usual commands to configure the kernel, build
the image, the device tree binaries, the modules and have the
modules installed in a specific directory, but first we'll
add some extra config options:
cd kernel_dir
KERNEL=kernel
make ARCH=arm CROSS_COMPILE=arm-linux-gnueabi- bcmrpi_defconfig
We'll need to add at least ext4 builtin support so that the
kernel can mount the rootfs, and I2C support for our
experiments, so we need to edit .config, add
these:
CONFIG_EXT4_FS=y
CONFIG_I2C=y
And run the olddefconfig target. Then we can
proceed with the rest of the build steps:
make ARCH=arm CROSS_COMPILE=arm-linux-gnueabi- olddefconfig
make ARCH=arm CROSS_COMPILE=arm-linux-gnueabi- zImage modules dtbs -j$(nproc)
mkdir modules
make ARCH=arm CROSS_COMPILE=arm-linux-gnueabi- INSTALL_MOD_PATH=./modules modules_install
Now we need to copy the kernel and the dtbs to the boot partition of the
sd card:
(we really only need the dtb for this particular board, but
anyway).
Setting up a Debian rootfs
There are many ways to do this, but I normally use the classic
debootstrap
to build Debian rootfss. Since I don't always know which
packages I'll need to install ahead of time, the strategy I
follow is to build a minimal image with the bare minimum
requirements and then boot it either on a virtual machine or
in the final target and do the rest of the installation and
setup there. So for the initial setup I'll only include the
openssh-server package:
mkdir bookworm_armel_raspi
sudo debootstrap --arch armel --include=openssh-server bookworm \
        bookworm_armel_raspi http://deb.debian.org/debian

# Remove the root password
sudo sed -i '/^root/ { s/:x:/::/ }' bookworm_armel_raspi/etc/passwd

# Create a pair of ssh keys and install them to allow passwordless
# ssh logins
cd ~/.ssh
ssh-keygen -f raspi
sudo mkdir bookworm_armel_raspi/root/.ssh
cat raspi.pub | sudo tee bookworm_armel_raspi/root/.ssh/authorized_keys
Now we'll copy the kernel modules to the rootfs. From the kernel directory, and
based on the build instructions above:
cd kernel_dir
sudo cp -fr modules/lib/modules /path_to_rootfs_mountpoint/lib
If your distro provides qemu static binaries (eg. Debian:
qemu-user-static), it's a good idea to copy the qemu binary to the
rootfs so we can mount it locally and run apt-get on it:
Otherwise, we can boot a kernel on qemu and load the rootfs there to
continue the installation. Next we'll create and populate the filesystem
image, then we can boot it on qemu for additional tweaks or
dump it into the rootfs partition of the SD card:
# Make rootfs image
fallocate -l 2G bookworm_armel_raspi.img
sudo mkfs -t ext4 bookworm_armel_raspi.img
sudo mkdir /mnt/rootfs
sudo mount -o loop bookworm_armel_raspi.img /mnt/rootfs/
sudo cp -a bookworm_armel_raspi/* /mnt/rootfs/
sudo umount /mnt/rootfs
(Substitute /dev/sda2 for the sd card rootfs
partition in your system).
At this point, if we need to do any extra configuration steps
we can either:
Mount the SD card and make the changes there.
Boot the filesystem image in qemu with a suitable kernel
and make the changes in a live system, then dump the
changes into the SD card again.
Boot the board and make the changes there directly. For
this we'll need to access the board serial console through
its UART pins.
Here are some of the changes I made. First, network
configuration. I'm setting up a dedicated point-to-point
Ethernet link between the development machine (a Linux laptop)
and the Raspberry Pi, with fixed IPs. That means I'll use a
separate subnet for this minimal LAN and that the laptop will
forward traffic between the Ethernet nic and the WLAN
interface that's connected to the Internet. In the rootfs I
added a file
(/etc/systemd/network/20-wired.network) with the
following contents:
Where 192.168.2.101 is the address of the board NIC and
192.168.2.100 is the one of the Eth NIC in my laptop. Then,
assuming we have access to the serial console of the board and
we logged in as root, we need to
enable systemd-networkd:
systemctl enable systemd-networkd
Additionally, we need to edit the ssh server configuration to
allow login as root. We can do this by
setting PermitRootLogin yes
in /etc/ssh/sshd_config.
In the development machine, I configured the traffic
forwarding to the WLAN interface:
1: Although in this case the thread is a regular
kernel thread and runs on the same memory space as the rest of
the code, so there's no memory protection. See
the User
Mode page in the docs for more
details.↩
2: As a reference, for the Raspberry Pi Pico 2W,
this
is where the ISR is registered
for enabled
GPIO devices,
and this
is the ISR that checks the pin status and triggers the
registered callbacks.↩
Adaptation of WPE WebKit targeting the Android operating system.
WPE-Android has been updated to use WebKit 2.48.5. This update particular interest for development on Android is the support for using the system logd service, which can be configured using system properties. For example, the following will enable logging all warnings:
adb shell setprop debug.log.WPEWebKit all
adb shell setprop log.tag.WPEWebKit WARN
Stable releases of WebKitGTK 2.48.5 and WPE WebKit 2.48.5 are now available. These include the fixes and improvements from the corresponding2.48.4 ones, and additionally solve a number of security issues. Advisory WSA-2025-0005 (GTK, WPE) covers the included security patches.
Ruby was re-added to the GNOME SDK, thanks to Michael Catanzaro and Jordan Petridis. So we're happy to report that the WebKitGTK nightly builds for GNOME Web Canary are now fixed and Canary updates were resumed.
August greetings, comrades! Today I want to bookend some recent work on
my Immix-inspired garbage
collector:
firstly, an idea with muddled results, then a slog through heuristics.
the big idea
My mostly-marking collector’s main space is called the “nofl space”.
Its name comes from its historical evolution from mark-sweep to mark-region:
instead of sweeping unused memory to freelists and allocating from those
freelists, sweeping is interleaved with allocation; “nofl” means
“no free-list”. As it finds holes, the collector bump-pointer allocates into those
holes. If an allocation doesn’t fit into the current hole, the collector sweeps
some more to find the next hole, possibly fetching another block. Space
for holes that are too small is effectively wasted as fragmentation;
mutators will try again after the next GC. Blocks with lots of
holes will be chosen for opportunistic evacuation, which is the heap
defragmentation mechanism.
Hole-too-small fragmentation has bothered me, because it presents a
potential pathology. You don’t know how a GC will be used or what the
user’s allocation pattern will be; if it is a mix of medium (say, a
kilobyte) and small (say, 16 bytes) allocations, one could imagine a
medium allocation having to sweep over lots of holes, discarding them in
the process, which hastens the next collection. Seems wasteful,
especially for non-moving configurations.
So I had a thought: why not collect those holes into a size-segregated
freelist? We just cleared the hole, the memory is core-local, and we
might as well. Then before fetching a new block, the allocator
slow-path can see if it can service an allocation from the second-chance
freelist of holes. This decreases locality a bit, but maybe it’s worth
it.
Thing is, I implemented it, and I don’t know if it’s worth it! It seems
to interfere with evacuation, in that the blocks that would otherwise be
most profitable to evacuate, because they contain many holes, are
instead filled up with junk due to second-chance allocation from the
freelist. I need to do more measurements, but I think my big-brained
idea is a bit of a wash, at least if evacuation is enabled.
heap growth
When running the new collector in Guile, we have a performance oracle in
the form of BDW: it had better be faster for Guile to compile a Scheme
file with the new nofl-based collector than with BDW. In this use case
we have an additional degree of freedom, in that unlike the lab tests of
nofl vs BDW, we don’t impose a fixed heap size, and instead allow
heuristics to determine the growth.
BDW’s built-in heap growth heuristics are very opaque. You give it a
heap multiplier, but as a divisor truncated to an integer. It’s very
imprecise. Additionally, there are nonlinearities: BDW is relatively
more generous for smaller heaps, because attempts to model and amortize
tracing cost, and there are some fixed costs (thread sizes, static data
sizes) that don’t depend on live data size.
Thing is, BDW’s heuristics work pretty well. For example, I had a
process that ended with a heap of about 60M, for a peak live data size
of 25M or so. If I ran my collector with a fixed heap multiplier, it
wouldn’t do as well as BDW, because it collected much more frequently
when the heap was smaller.
I ended up switching from the primitive
“size the heap as a multiple of live data” strategy to live data plus a
square root factor; this is like what Racket ended up doing in its
simple implementation of MemBalancer. (I do have a proper implementation
of MemBalancer, with time measurement and shrinking and all, but I
haven’t put it through its paces yet.) With this fix I can meet BDW’s performance
for my Guile-compiling-Guile-with-growable-heap workload. It would be
nice to exceed BDW of course!
parallel worklist tweaks
Previously, in parallel configurations, trace workers would each have a
Chase-Lev deque to which they could publish objects needing tracing.
Any worker could steal an object from the top of a worker’s public
deque. Also, each worker had a local, unsynchronized FIFO worklist,
some 1000 entries in length; when this worklist filled up, the worker
would publish its contents.
There is a pathology for this kind of setup, in which one worker can end
up with a lot of work that it never publishes. For example, if there
are 100 long singly-linked lists on the heap, and the worker happens to have them all on
its local FIFO, then perhaps they never get published, because the FIFO
never overflows; you end up not parallelising. This seems to be the case
in one microbenchmark. I switched to not have local worklists at all;
perhaps this was not the right thing, but who knows. Will poke in
future.
a hilarious bug
Sometimes you need to know whether a given address is in an object
managed by the garbage collector. For the nofl space it’s pretty easy,
as we have big slabs of memory; bisecting over the array of slabs is
fast. But for large objects whose memory comes from the kernel, we
don’t have that. (Yes, you can reserve a big ol’ region with
PROT_NONE and such, and then allocate into that region; I don’t do
that currently.)
Previously I had a splay tree for lookup. Splay trees are great but not
so amenable to concurrent access, and parallel marking is one place where we need to do this lookup. So I prepare a sorted array before marking, and then
bisect over that array.
Except a funny thing happened: I switched the bisect routine to return
the start address if an address is in a region. Suddenly, weird
failures started happening randomly. Turns out, in some places I was
testing if bisection succeeded with an int; if the region happened to
be 32-bit-aligned, then the nonzero 64-bit uintptr_t got truncated to its low 32
bits, which were zero. Yes, crusty reader, Rust would have caught this!
fin
I want this new collector to work. Getting the growth heuristic good
enough is a step forward. I am annoyed that second-chance allocation
didn’t work out as well as I had hoped; perhaps I will find some time
this fall to give a proper evaluation. In any case, thanks for reading,
and hack at you later!
I recently started playing around
with Zephyr,
reading about it and doing some experiments, and I figured
I'd rather jot down my impressions and findings so that the me
in the future, who'll have no recollection of ever doing this,
can come back to it as a reference. And if it's helpful for
anybody else, that's a nice bonus.
It's been a really long time since I last dove into embedded
programming for low-powered hardware and things have changed
quite a bit, positively, both in terms of hardware
availability for professionals and hobbyists and in the
software options. Back in the day, most of the open source
embedded OSs1 I tried
felt like toy operating systems: enough for simple
applications but not really suitable for more complex systems
(eg. not having a proper preemptive scheduler is a serious
limitation). In the proprietary side things looked better and
there were many more options but, of course, those weren't
freely available.
Nowadays, Zephyr has filled that gap in the open source
embedded OSs field2,
even becoming the de facto OS to use, something like
a "Linux for embedded": it feels like a full-fledged OS, it's
feature rich, flexible and scalable, it has an enormous
traction in embedded, it's widely supported by many of the big
names in the industry and it has plenty of available
documentation, resources and a thriving community. Currently,
if you need to pick an OS for embedded platforms, unless
you're targetting very minimal hardware (8/16bit
microcontrollers), it's a no brainer.
Noteworthy features
One of the most interesting qualities of Zephyr is its
flexibility: the base system is lean and has a small
footprint, and at the same time it's easy to grow a
Zephyr-based firmware for more complex applications thanks to
the variety of supported features. These are some of them:
Feature-rich
kernel core
services: for a small operating system, the amount of
core services available is quite remarkable. Most of the
usual tools for general application development are there:
thread-based runtime with preemptive and cooperative
scheduling, multiple synchronization and IPC mechanisms,
basic memory management functions, asynchronous and
event-based programming support, task management, etc.
SMP support.
Extensive core library: including common data structures,
shell support and a POSIX compatibility layer.
Logging and tracing: simple but capable facilities with
support for different backends, easy to adapt to the
hardware and application needs.
Native
simulation target
and device
emulation: allows to build applications as native
binaries that can run on the development platform for
prototyping and debugging purposes.
Now let's move on and get some actual hands on experience
with Zephyr. The first thing we'll do is to set up a basic
development environment so we can start writing some
experiments and testing them. It's a good idea to keep a
browser tab open on
the Zephyr
docs, so we can reference them when needed or search for
more detailed info.
Development environment setup
The development environment is set up and contained within a
python venv. The Zephyr project provides
the west
command line tool to carry out all the setup and build
steps.
The basic tool requirements in Linux are CMake, Python3 and
the device tree compiler. Assuming they are installed and
available, we can then set up a development environment like
this:
python3 -m venv zephyrproject/.venv
. zephyrproject/.venv/bin/activate

# Now inside the venv

pip install west
west init zephyrproject
cd zephyrproject
west update

west zephyr-export
west packages pip --install
Some basic nomenclature: the zephyrproject
directory is known as a west "workspace". Inside it,
the zephyr directory contains the repo of Zephyr
itself.
Next step is to install the Zephyr SDK, ie. the toolchains
and other host tools. I found this step a bit troublesome and
it could have better defaults. By default it will install all
the available SDKs (many of which we won't need) and then all
the host tools (which we may not need either). Also, in my
setup, the script that install the host tools fails with a
buffer overflow, so instead of relying on it to install the
host tools (in my case I only needed qemu) I installed it
myself. This has some drawbacks: we might be missing some
features that are in the custom qemu binaries provided by the
SDK, and west won't be able to run our apps on
qemu automatically, we'll have to do that ourselves. Not ideal
but not a dealbreaker either, I could figure it out and run
that myself just fine.
So I recommend to install the SDK interactively so we can
select the toolchains we want and whether we want to install
the host tools or not (in my case I didn't):
cd zephyr
west sdk install -i
For the initial tests I'm targetting riscv64 on qemu, we'll
pick up other targets later. In my case, since the host tools
installation failed on my setup, I needed to
provide qemu-system-riscv64 myself, you probably
won't have to do that.
Now, to see if everything is set up correctly, we can try to
build the simplest example program there
is: samples/hello_world. To build it
for qemu_riscv64 we can use west
like this:
west build -p always -b qemu_riscv64 samples/hello_world
Where -p always tells west to do a
pristine build ,ie. build everything every time. We may not
need that necessarily but for now it's a safe flag to use.
Then, to run the app in qemu, the standard way is to
do west build -t run, but if we didn't install
the Zephyr host tools we'll need to run qemu ourselves:
Architecture-specific note: we're
calling qemu-system-riscv64 with -bios
none to prevent qemu from loading OpenSBI into address
0x80000000. Zephyr doesn't need OpenSBI and it's loaded into
that address, which is where qemu-riscv's ZSBL jumps
to3.
Starting a new application
The Zephyr
Example Application repo repo contains an example
application that we can use as a reference for a workspace
application (ie. an application that lives in the
`zephyrproject` workspace we created earlier). Although we
can use it as a reference, I didn't have a good experience
with it
According to the docs, we can simply clone the example
application repo into an existing workspace, but that
doesn't seem to work, and it looks
like the
docs are wrong about that.
,
so I recommend to start from scratch or to take the
example applications in the zephyr/samples
directory as templates as needed.
To create a new application, we simply have to make a
directory for it in the workspace dir and write a minimum set of
required files:
where test_app is the name of the
application. prj.conf is meant to contain
application-specific config options and will be empty for
now. README.rst is optional.
Assuming the code in main.c is correct, we can
then build the application for a specific target with:
west build -p always -b <target> <app_name>
where <app_name> is the directory containing the
application files listed above. Note that west
uses CMake under the hood, so the build will be based on
whatever build system CMake uses
(apparently, ninja by default), so many of these
operations can also be done at a lower level using the
underlying build system commands (not recommended).
Building for different targets
Zephyr supports building applications for different target
types or abstractions. While the end goal will normally be to
have a firmare running on a SoC, for debugging purposes, for
testing or simply to carry out most of the development without
relying on hardware, we can target qemu to run the application
on an emulated environment, or we can even build the app as a
native binary to run on the development machine.
The differences between targets can be abstracted through
proper use of APIs and device tree definitions so, in theory,
the same application (with certain limitations) can be
seamlessly built for different targets without modifications,
and the build process takes care of doing the right thing
depending on the target.
As an example, let's build and run
the hello_world sample program in three different
targets with different architectures: native_sim
(x86_64 with emulated devices), qemu (Risc-V64 with full system
emulation) and a real board,
a Raspberry
Pi Pico 2W (ARM Cortex-M33).
Before starting, let's clean up any previous builds:
west build -t clean
Now, to build and run the application as a native binary:
west build -t clean
west build -p always -b qemu_riscv64 zephyr/samples/hello_world
[... omitted build output]

west build -t run
*** Booting Zephyr OS build v4.1.0-6569-gf4a0beb2b7b1 ***
Hello World! qemu_riscv64/qemu_virt_riscv64
For the Raspberry Pi Pico 2W:
west build -t clean
west build -p always -b rpi_pico2/rp2350a/m33 zephyr/samples/hello_world
[... omitted build output]

west flash -r uf2
In this case, flashing and checking the console output are
board-specific steps. Assuming the flashing process worked, if
we connect to the board UART0, we can see the output
message:
*** Booting Zephyr OS build v4.1.0-6569-gf4a0beb2b7b1 ***
Hello World! rpi_pico2/rp2350a/m33
Note that the application prints that line like this:
This shows we can easily build our applications using
hardware abstractions and have them working on different
platforms using the same code and build environment.
What's next?
Now that we're set and ready to work and the environment is
all set up, we can start doing more interesting things. In a
follow-up post I'll show a concrete example of an application
that showcases most of the features
listed above.
1: Most of them are generally labelled as RTOSs,
although the "RT" there is used rather
loosely.↩
2: ThreadX is now an option too, having become
open source recently. It brings certain features that are
more common in proprietary systems, such as security
certifications, and it looks like it was designed in a more
focused way. In contrast, it lacks the ecosystem and other
perks of open source projects (ease of adoption, rapid
community-based growth).↩
…and I immediately thought, This is a perfect outer-limits probe! By which I mean, if I hand a browser values that are effectively infinite by way of theinfinity keyword, it will necessarily end up clamping to something finite, thus revealing how far it’s able or willing to go for that property.
The first thing I did was exactly what Andy proposed, with a few extras to zero out box model extras:
Then I loaded the (fully valid HTML 5) test page in Firefox Nightly, Chrome stable, and Safari stable, all on macOS, and things pretty immediately got weird:
Element Size Results
Browser
Computed value
Layout value
Safari
33,554,428
33,554,428
Chrome
33,554,400
33,554,400
Firefox (Nightly)
19.2 / 17,895,700
19.2 / 8,947,840 †
† height / width
Chrome and Safari both get very close to 225-1 (33,554,431), with Safari backing off from that by just 3 pixels, and Chrome by 31. I can’t even hazard a guess as to why this sort of value would be limited in that way; if there was a period of time where 24-bit values were in vogue, I must have missed it. I assume this is somehow rooted in the pre-Blink-fork codebase, but who knows. (Seriously, who knows? I want to talk to you.)
But the faint whiff of oddness there has nothing on what’s happening in Firefox. First off, the computed height is19.2px, which is the height of a line of text at default font size and line height. If I explicitly gave it line-height: 1, the height of the <div> changes to 16px. All this is despite my assigning a height of infinite pixels! Which, to be fair, is not really possible to do, but does it make sense to just drop it on the floor rather than clamp to an upper bound?
Even if that can somehow be said to make sense, it only happens with height. The computed width value is, as indicated, nearly 17.9 million, which is not the content width and is also nowhere close to any power of two. But the actual layout width, according to the diagram in the Layout tab, is just over 8.9 million pixels; or, put another way, one-half of 17,895,700 minus 10.
This frankly makes my brain hurt. I would truly love to understand the reasons for any of these oddities. If you know from whence they arise, please, please leave a comment! The more detail, the better. I also accept trackbacks from blog posts if you want to get extra-detailed.
For the sake of my aching skullmeats, I almost called a halt there, but I decided to see what happened with font sizes.
My skullmeats did not thank me for this, because once again, things got… interesting.
Font Size Results
Browser
Computed value
Layout value
Safari
100,000
100,000
Chrome
10,000
10,000
Firefox (Nightly)
3.40282e38
2,400 / 17,895,700 †
† line height values of normal /1
Safari and Chrome have pretty clearly set hard limits, with Safari’s an order of magnitude larger than Chrome’s. I get it: what are the odds of someone wanting their text to be any larger than, say, a viewport height, let alone ten or 100 times that height? What intrigues me is the nature of the limits, which are so clearly base-ten numbers that someone typed in at some point, rather than being limited by setting a register size or variable length or something that would have coughed up a power of two.
And speaking of powers of two… ah, Firefox. Your idiosyncrasy continues. The computed value is a 32-bit single-precision floating-point number. It doesn’t get used in any of the actual rendering, but that’s what it is. Instead, the actual font size of the text, as judged by the Box Model diagram on the Layout tab, is… 2,400 pixels.
Except, I can’t say that’s the actual actual font size being used: I suspect the actual value is 2,000 with a line height of 1.2, which is generally what normal line heights are in browsers. “So why didn’t you just set line-height: 1 to verify that, genius?” I hear you asking. I did! And that’s when the layout height of the <div> bloomed to just over 8.9 million pixels, like it probably should have in the previous test! And all the same stuff happened when I moved the styles from the<div> to the <body>!
I’ve started writing at least three different hypotheses for why this happens, and stopped halfway through each because each hypothesis self-evidently fell apart as I was writing it. Maybe if I give my whimpering neurons a rest, I could come up with something. Maybe not. All I know is, I’d be much happier if someone just explained it to me; bonus points if their name is Clarissa.
Since setting line heights opened the door to madness in font sizing, I thought I’d try setting line-height to infinite pixels and see what came out. This time, things were (relatively speaking) more sane.
Line Height Results
Browser
Computed value
Layout value
Safari
33,554,428
33,554,428
Chrome
33,554,400
33,554,400
Firefox (Nightly)
17,895,700
8,947,840
Essentially, the results were the same as what happened with element widths in the first example: Safari and Chrome were very close to 225-1, and Firefox had its thing of a strange computed value and a rendering size not quite half the computed value.
I’m sure there’s a fair bit more to investigate about infinite-pixel values, or about infinite values in general, but I’m going to leave this here because my gray matter needs a rest and possibly a pressure washing. Still, if you have ideas for infinitely fun things to jam into browser engines and see what comes out, let me know. I’m already wondering what kind of shenanigans, other than in z-index, I can get up to with calc(-infinity)…
Things happen in GNOME? Could have fooled me, right?
Of course, things happen in GNOME. After all, we have been releasing every
six months, on the dot, for nearly 25 years. Assuming we’re not constantly
re-releasing the same source files, then we have to come to the conclusion
that things change inside each project that makes GNOME, and thus things
happen that involve more than one project.
So let’s roll back a bit.
GNOME’s original sin
We all know Havoc Pennington’s essay on
preferences; it’s one of GNOME’s
foundational texts, we refer to it pretty much constantly both inside and
outside the contributors community. It has guided our decisions and taste
for over 20 years. As far as foundational text goes, though, it applies to
design philosophy, not to project governance.
When talking about the inception and technical direction of the GNOME project
there are really two foundational texts that describe the goals of GNOME, as
well as the mechanisms that are employed to achieve those goals.
The first one is, of course, Miguel’s announcement of the GNOME project
itself, sent to the GTK, Guile, and (for good measure) the KDE mailing lists:
We will try to reuse the existing code for GNU programs as
much as possible, while adhering to the guidelines of the project.
Putting nice and consistent user interfaces over all-time
favorites will be one of the projects.
— Miguel de Icaza, “The GNOME Desktop project.” announcement email
Once again, everyone related to the GNOME project is (or should be) familiar
with this text.
The second foundational text is not as familiar, outside of the core group
of people that were around at the time. I am referring to Derek Glidden’s
description of the differences between GNOME and KDE, written five years
after the inception of the project. I isolated a small fragment of it:
Development strategies are generally determined by whatever light show happens
to be going on at the moment, when one of the developers will leap up and scream
“I WANTITTOLOOKJUSTLIKETHAT” and then straight-arm his laptop against the
wall in an hallucinogenic frenzy before vomiting copiously, passing out and
falling face-down in the middle of the dance floor.
— Derek Glidden, “GNOME vs KDE”
What both texts have in common is subtle, but explains the origin of the
project. You may not notice it immediately, but once you see it you can’t
unsee it: it’s the over-reliance on personal projects and taste, to be
sublimated into a shared vision. A “bottom up” approach, with “nice and
consistent user interfaces” bolted on top of “all-time favorites”, with zero
indication of how those nice and consistent UIs would work on extant code
bases, all driven by somebody’s with a vision—drug induced or otherwise—that
decides to lead the project towards its implementation.
It’s been nearly 30 years, but GNOME still works that way.
Sure, we’ve had a HIG for 25 years, and the shared development resources
that the project provides tend to mask this, to the point that everyone
outside the project assumes that all people with access to the GNOME commit
bit work on the whole project, as a single unit. If you are here, listening
(or reading) to this, you know it’s not true. In fact, it is so comically
removed from the lived experience of everyone involved in the project that
we generally joke about it.
Herding cats and vectors sum
During my first GUADEC, back in 2005, I saw a great slide from Seth Nickell,
one of the original GNOME designers. It showed GNOME contributors
represented as a jumble of vectors going in all directions, cancelling each
component out; and the occasional movement in the project was the result of
somebody pulling/pushing harder in their direction.
Of course, this is not the exclusive province of GNOME: you could take most
complex free and open source software projects and draw a similar diagram. I
contend, though, that when it comes to GNOME this is not emergent behaviour
but it’s baked into the project from its very inception: a loosey-goosey
collection of cats, herded together by whoever shows up with “a vision”,
but, also, a collection of loosely coupled projects. Over the years we tried
to put a rest to the notion that GNOME is a box of LEGO, meant to be
assembled together by distributors and users in the way they most like it;
while our software stack has graduated from the “thrown together at the last
minute” quality of its first decade, our community is still very much
following that very same model; the only way it seems to work is because
we have a few people maintaining a lot of components.
On maintainers
I am a software nerd, and one of the side effects of this terminal condition
is that I like optimisation problems. Optimising software is inherently
boring, though, so I end up trying to optimise processes and people. The
fundamental truth of process optimisation, just like software, is to avoid
unnecessary work—which, in some cases, means optimising away the people involved.
I am afraid I will have to be blunt, here, so I am going to ask for your
forgiveness in advance.
Let’s say you are a maintainer inside a community of maintainers. Dealing
with people is hard, and the lord forbid you talk to other people about what
you’re doing, what they are doing, and what you can do together, so you only
have a few options available.
The first one is: you carve out your niche. You start, or take over, a
project, or an aspect of a project, and you try very hard to make yourself
indispensable, so that everything ends up passing through you, and everyone
has to defer to your taste, opinion, or edict.
Another option: API design is opinionated, and reflects the thoughts of the
person behind it. By designing platform API, you try to replicate your
toughts, taste, and opinions into the minds of the people using it, like the
eggs of parasitic wasp; because if everybody thinks like you, then there
won’t be conflicts, and you won’t have to deal with details, like “how to
make this application work”, or “how to share functionality”; or, you know,
having to develop a theory of mind for relating to other people.
Another option: you try to reimplement the entirety of a platform by
yourself. You start a bunch of projects, which require starting a bunch of
dependencies, which require refactoring a bunch of libraries, which ends up
cascading into half of the stack. Of course, since you’re by yourself, you
end up with a consistent approach to everything. Everything is as it ought
to be: fast, lean, efficient, a reflection of your taste, commitment, and
ethos. You made everyone else redundant, which means people depend on you,
but also nobody is interested in helping you out, because you are now taken
for granted, on the one hand, and nobody is able to get a word edgewise into
what you made on the other.
I purposefully did not name names, even though we can all recognise somebody
in these examples. For instance, I recognise myself. I have been all of
these examples, at one point or another over the past 20 years.
Painting a target on your back
But if this is what it looks like from within a project, what it looks like
from the outside is even worse.
Once you start dragging other people, you raise your visibility; people
start learning your name, because you appear in the issue tracker, on
Matrix/IRC, on Discourse and Planet GNOME. Youtubers and journalists start
asking you questions about the project. Randos on web forums start
associating you to everything GNOME does, or does not; to features, design,
and bugs. You become responsible for every decision, whether you are or not,
and this leads to being the embodiment of all evil the project does. You’ll
get hate mail, you’ll be harrassed, your words will be used against you and
the project for ever and ever.
Burnout and you
Of course, that ends up burning people out; it would be absurd if it didn’t.
Even in the best case possible, you’ll end up burning out just by reaching
empathy fatigue, because everyone has access to you, and everyone has their
own problems and bugs and features and wouldn’t it be great to solve every
problem in the world? This is similar to working for non profits as opposed
to the typical corporate burnout: you get into a feedback loop where you
don’t want to distance yourself from the work you do because the work you do
gives meaning to yourself and to the people that use it; and yet working on
it hurts you. It also empowers bad faith actors to hound you down to the
ends of the earth, until you realise that turning sand into computers was a
terrible mistake, and we should have torched the first personal computer
down on sight.
Governance
We want to have structure, so that people know what to expect and how to
navigate the decision making process inside the project; we also want to
avoid having a sacrificial lamb that takes on all the problems in the world
on their shoulders until we burn them down to a cinder and they have to
leave. We’re 28 years too late to have a benevolent dictator, self-appointed
or otherwise, and we don’t want to have a public consultation every time we
want to deal with a systemic feature. What do we do?
Examples
What do other projects have to teach us about governance? We are not the
only complex free software project in existence, and it would be an appaling
measure of narcissism to believe that we’re special in any way, shape or form.
Python
We should all know what a Python PEP is, but if
you are not familiar with the process I strongly recommend going through it.
It’s well documented, and pretty much the de facto standard for any complex
free and open source project that has achieved escape velocity from a
centralised figure in charge of the whole decision making process. The real
achievement of the Python community is that it adopted this policy long
before their centralised figure called it quits. The interesting thing of
the PEP process is that it is used to codify the governance of the project
itself; the PEP template is a PEP; teams are defined through PEPs; target
platforms are defined through PEPs; deprecations are defined through PEPs;
all project-wide processes are defined through PEPs.
Rust
Rust has a similar process for language, tooling, and standard library
changes, called “RFC”. The RFC process
is more lightweight on the formalities than Python’s PEPs, but it’s still
very well defined. Rust, being a project that came into existence in a
Post-PEP world, adopted the same type of process, and used it to codify
teams, governance, and any and all project-wide processes.
Fedora
Fedora change proposals exist to discuss and document both self-contained
changes (usually fairly uncontroversial, given that they are proposed by the
same owners of module being changed) and system-wide changes. The main
difference between them is that most of the elements of a system-wide change
proposal are required, wheres for self-contained proposals they can be
optional; for instance, a system-wide change must have a contingency plan, a
way to test it, and the impact on documentation and release notes, whereas
as self-contained change does not.
GNOME
Turns out that we once did have “GNOME Enhancement
Proposals” (GEP), mainly modelled on
Python’s PEP from 2002. If this comes as a surprise, that’s because they
lasted for about a year, mainly because it was a reactionary process to try
and funnel some of the large controversies of the 2.0 development cycle into
a productive outlet that didn’t involve flames and people dramatically
quitting the project. GEPs failed once the community fractured, and people
started working in silos, either under their own direction or, more likely,
under their management’s direction. What’s the point of discussing a
project-wide change, when that change was going to be implemented by people
already working together?
The GEP process mutated into the lightweight “module proposal” process,
where people discussed adding and removing dependencies on the desktop
development mailing list—something we also lost over the 2.x cycle, mainly
because the amount of discussions over time tended towards zero. The people
involved with the change knew what those modules brought to the release, and
people unfamiliar with them were either giving out unsolicited advice, or
were simply not reached by the desktop development mailing list. The
discussions turned into external dependencies notifications, which also died
up because apparently asking to compose an email to notify the release team
that a new dependency was needed to build a core module was far too much of
a bother for project maintainers.
The creation and failure of GEP and module proposals is both an indication
of the need for structure inside GNOME, and how this need collides with the
expectation that project maintainers have not just complete control over
every aspect of their domain, but that they can also drag out the process
until all the energy behind it has dissipated. Being in charge for the long
run allows people to just run out the clock on everybody else.
Goals
So, what should be the goal of a proper technical governance model for the
GNOME project?
Diffusing responsibilities
This should be goal zero of any attempt at structuring the technical
governance of GNOME. We have too few people in too many critical positions.
We can call it “efficiency”, we can call it “bus factor”, we can call it
“bottleneck”, but the result is the same: the responsibility for anything is
too concentrated. This is how you get conflict. This is how you get burnout.
This is how you paralise a whole project. By having too few people in
positions of responsibility, we don’t have enough slack in the governance
model; it’s an illusion of efficiency.
Responsibility is not something to hoard: it’s something to distribute.
Empowering the community
The community of contributors should be able to know when and how a decision
is made; it should be able to know what to do once a decision is made. Right
now, the process is opaque because it’s done inside a million different
rooms, and, more importantly, it is not recorded for posterity. Random
GitLab issues should not be the only place where people can be informed that
some decision was taken.
Empowering individuals
Individuals should be able to contribute to a decision without necessarily
becoming responsible for a whole project. It’s daunting, and requires a
measure of hubris that cannot be allowed to exist in a shared space. In a
similar fashion, we should empower people that want to contribute to the
project by reducing the amount of fluff coming from people with zero stakes
in it, and are interested only in giving out an opinion on their perfectly
spherical, frictionless desktop environment.
It is free and open source software, not free and open mic night down at
the pub.
Actual decision making process
We say we work by rough consensus, but if a single person is responsible for
multiple modules inside the project, we’re just deceiving ourselves. I
should not be able to design something on my own, commit it to all projects
I maintain, and then go home, regardless of whether what I designed is good
or necessary.
Proposed GNOME Changes✝
✝ Name subject to change
PGCs
We have better tools than what the GEP used to use and be. We have better
communication venues in 2025; we have better validation; we have better
publishing mechanisms.
We can take a lightweight approach, with a well-defined process, and use it
not for actual design or decision-making, but for discussion and
documentation. If you are trying to design something and you use this
process, you are by definition Doing It Wrong™. You should have a design
ready, and series of steps to achieve it, as part of a proposal. You should
already know the projects involved, and already have an idea of the effort
needed to make something happen.
Once you have a formal proposal, you present it to the various stakeholders,
and iterate over it to improve it, clarify it, and amend it, until you have
something that has a rough consensus among all the parties involved. Once
that’s done, the proposal is now in effect, and people can refer to it
during the implementation, and in the future. This way, we don’t have to ask
people to remember a decision made six months, two years, ten years ago:
it’s already available.
Editorial team
Proposals need to be valid, in order to be presented to the community at
large; that validation comes from an editorial team. The editors of the
proposals are not there to evaluate its contents: they are there to ensure
that the proposal is going through the expected steps, and that discussions
related to it remain relevant and constrained within the accepted period and
scope. They are there to steer the discussion, and avoid architecture
astronauts parachuting into the issue tracker or Discourse to give their
unwarranted opinion.
Once the proposal is open, the editorial team is responsible for its
inclusion in the public website, and for keeping track of its state.
Steering group
The steering group is the final arbiter of a proposal. They are responsible
for accepting it, or rejecting it, depending on the feedback from the
various stakeholders. The steering group does not design or direct GNOME as
a whole: they are the ones that ensure that communication between the parts
happens in a meaningful manner, and that rough consensus is achieved.
The steering group is also, by design, not the release team: it is made of
representatives from all the teams related to technical matters.
Is this enough?
Sadly, no.
Reviving a process for proposing changes in GNOME without addressing the
shortcomings of its first iteration would inevitably lead to a repeat of its results.
We have better tooling, but the problem is still that we’re demanding that
each project maintainer gets on board with a process that has no mechanism
to enforce compliance.
Once again, the problem is that we have a bunch of fiefdoms that need to be
opened up to ensure that more people can work on them.
Whither maintainers
In what was, in retrospect, possibly one of my least gracious and yet most
prophetic moments on the desktop development mailing list, I once said that,
if it were possible, I would have already replaced all GNOME maintainers
with a shell script. Turns out that we did replace a lot of what maintainers
used to do, and we used a large Python
service
to do that.
Individual maintainers should not exist in a complex project—for both the
project’s and the contributors’ sake. They are inefficiency made manifest, a
bottleneck, a point of contention in a distributed environment like GNOME.
Luckily for us, we almost made them entirely redundant already! Thanks to
the release service and CI pipelines, we don’t need a person spinning up a
release archive and uploading it into a file server. We just need somebody
to tag the source code repository, and anybody with the right permissions
could do that.
We need people to review contributions; we need people to write release
notes; we need people to triage the issue tracker; we need people to
contribute features and bug fixes. None of those tasks require the
“maintainer” role.
So, let’s get rid of maintainers once and for all. We can delegate the
actual release tagging of core projects and applications to the GNOME
release team; they are already releasing GNOME anyway, so what’s the point
in having them wait every time for somebody else to do individual releases?
All people need to do is to write down what changed in a release, and that
should be part of a change itself; we have centralised release notes, and we
can easily extract the list of bug fixes from the commit log. If you can
ensure that a commit message is correct, you can also get in the habit of
updating the NEWS file as part of a merge request.
Additional benefits of having all core releases done by a central authority
are that we get people to update the release notes every time something
changes; and that we can sign all releases with a GNOME key that downstreams
can rely on.
Embracing special interest groups
But it’s still not enough.
Especially when it comes to the application development platform, we have
already a bunch of components with an informal scheme of shared
responsibility. Why not make that scheme official?
Let’s create the SDK special interest group; take all the developers for
the base libraries that are part of GNOME—GLib, Pango, GTK, libadwaita—and
formalise the group of people that currently does things like development,
review, bug fixing, and documentation writing. Everyone in the group should
feel empowered to work on all the projects that belong to that group. We
already are, except we end up deferring to somebody that is usually too busy
to cover every single module.
Other special interest groups should be formed around the desktop, the core
applications, the development tools, the OS integration, the accessibility
stack, the local search engine, the system settings.
Adding more people to these groups is not going to be complicated, or
introduce instability, because the responsibility is now shared; we would
not be taking somebody that is already overworked, or even potentially new
to the community, and plopping them into the hot seat, ready for a burnout.
Each special interest group would have a representative in the steering
group, alongside teams like documentation, design, and localisation, thus
ensuring that each aspect of the project technical direction is included in
any discussion. Each special interest group could also have additional
sub-groups, like a web services group in the system settings group; or a
networking group in the OS integration group.
What happens if I say no?
I get it. You like being in charge. You want to be the one calling the
shots. You feel responsible for your project, and you don’t want other
people to tell you what to do.
If this is how you feel, then there’s nothing wrong with parting ways with
the GNOME project.
GNOME depends on a ton of projects hosted outside GNOME’s own
infrastructure, and we communicate with people maintaining those projects
every day. It’s 2025, not 1997: there’s no shortage of code hosting services
in the world, we don’t need to have them all on GNOME infrastructure.
If you want to play with the other children, if you want to be part of
GNOME, you get to play with a shared set of rules; and that means sharing
all the toys, and not hoarding them for yourself.
Civil service
What we really want GNOME to be is a group of people working together. We
already are, somewhat, but we can be better at it. We don’t want rule and
design by committee, but we do need structure, and we need that structure to
be based on expertise; to have distinct sphere of competence; to have
continuity across time; and to be based on rules. We need something
flexible, to take into account the needs of GNOME as a project, and be
capable of growing in complexity so that nobody can be singled out, brigaded
on, or burnt to a cinder on the sacrificial altar.
Our days of passing out in the middle of the dance floor are long gone. We
might not all be old—actually, I’m fairly sure we aren’t—but GNOME has long
ceased to be something we can throw together at the last minute just because
somebody assumed the mantle of a protean ruler, and managed to involve
themselves with every single project until they are the literal embodiement
of an autocratic force capable of dragging everybody else towards a goal,
until the burn out and have to leave for their own sake.
We can do better than this. We must do better.
To sum up
Stop releasing individual projects, and let the release team do it when needed.
Create teams to manage areas of interest, instead of single projects.
Create a steering group from representatives of those teams.
Every change that affects one or more teams has to be discussed and
documented in a public setting among contributors, and then published for
future reference.
None of this should be controversial because, outside of the publishing bit,
it’s how we are already doing things. This proposal aims at making it
official so that people can actually rely on it, instead of having to divine
the process out of thin air.
The next steps
We’re close to the GNOME 49 release, now that GUADEC 2025 has ended, so
people are busy working on tagging releases, fixing bugs, and the work on
the release notes has started. Nevertheless, we can already start planning
for an implementation of a new governance model for GNOME for the next cycle.
First of all, we need to create teams and special interest groups. We don’t
have a formal process for that, so this is also a great chance at
introducing the change proposal process as a mechanism for structuring the
community, just like the Python and Rust communities do. Teams will need
their own space for discussing issues, and share the load. The first team
I’d like to start is an “introspection and language bindings” group, for all
bindings hosted on GNOME infrastructure; it would act as a point of
reference for all decisions involving projects that consume the GNOME
software development platform through its machine-readable ABI description.
Another group I’d like to create is an editorial group for the developer and
user documentation; documentation benefits from a consistent editorial
voice, while the process of writing documentation should be open to
everybody in the community.
A very real issue that was raised during GUADEC is bootstrapping the
steering committee; who gets to be on it, what is the committee’s remit, how
it works. There are options, but if we want the steering committee to be a
representation of the technical expertise of the GNOME community, it also
has to be established by the very same community; in this sense, the board
of directors, as representatives of the community, could work on
defining the powers and compositions of this committee.
There are many more issues we are going to face, but I think we can start
from these and evaluate our own version of a technical governance model that
works for GNOME, and that can grow with the project. In the next couple of
weeks I’ll start publishing drafts for team governance and the
power/composition/procedure of the steering committee, mainly for iteration
and comments.


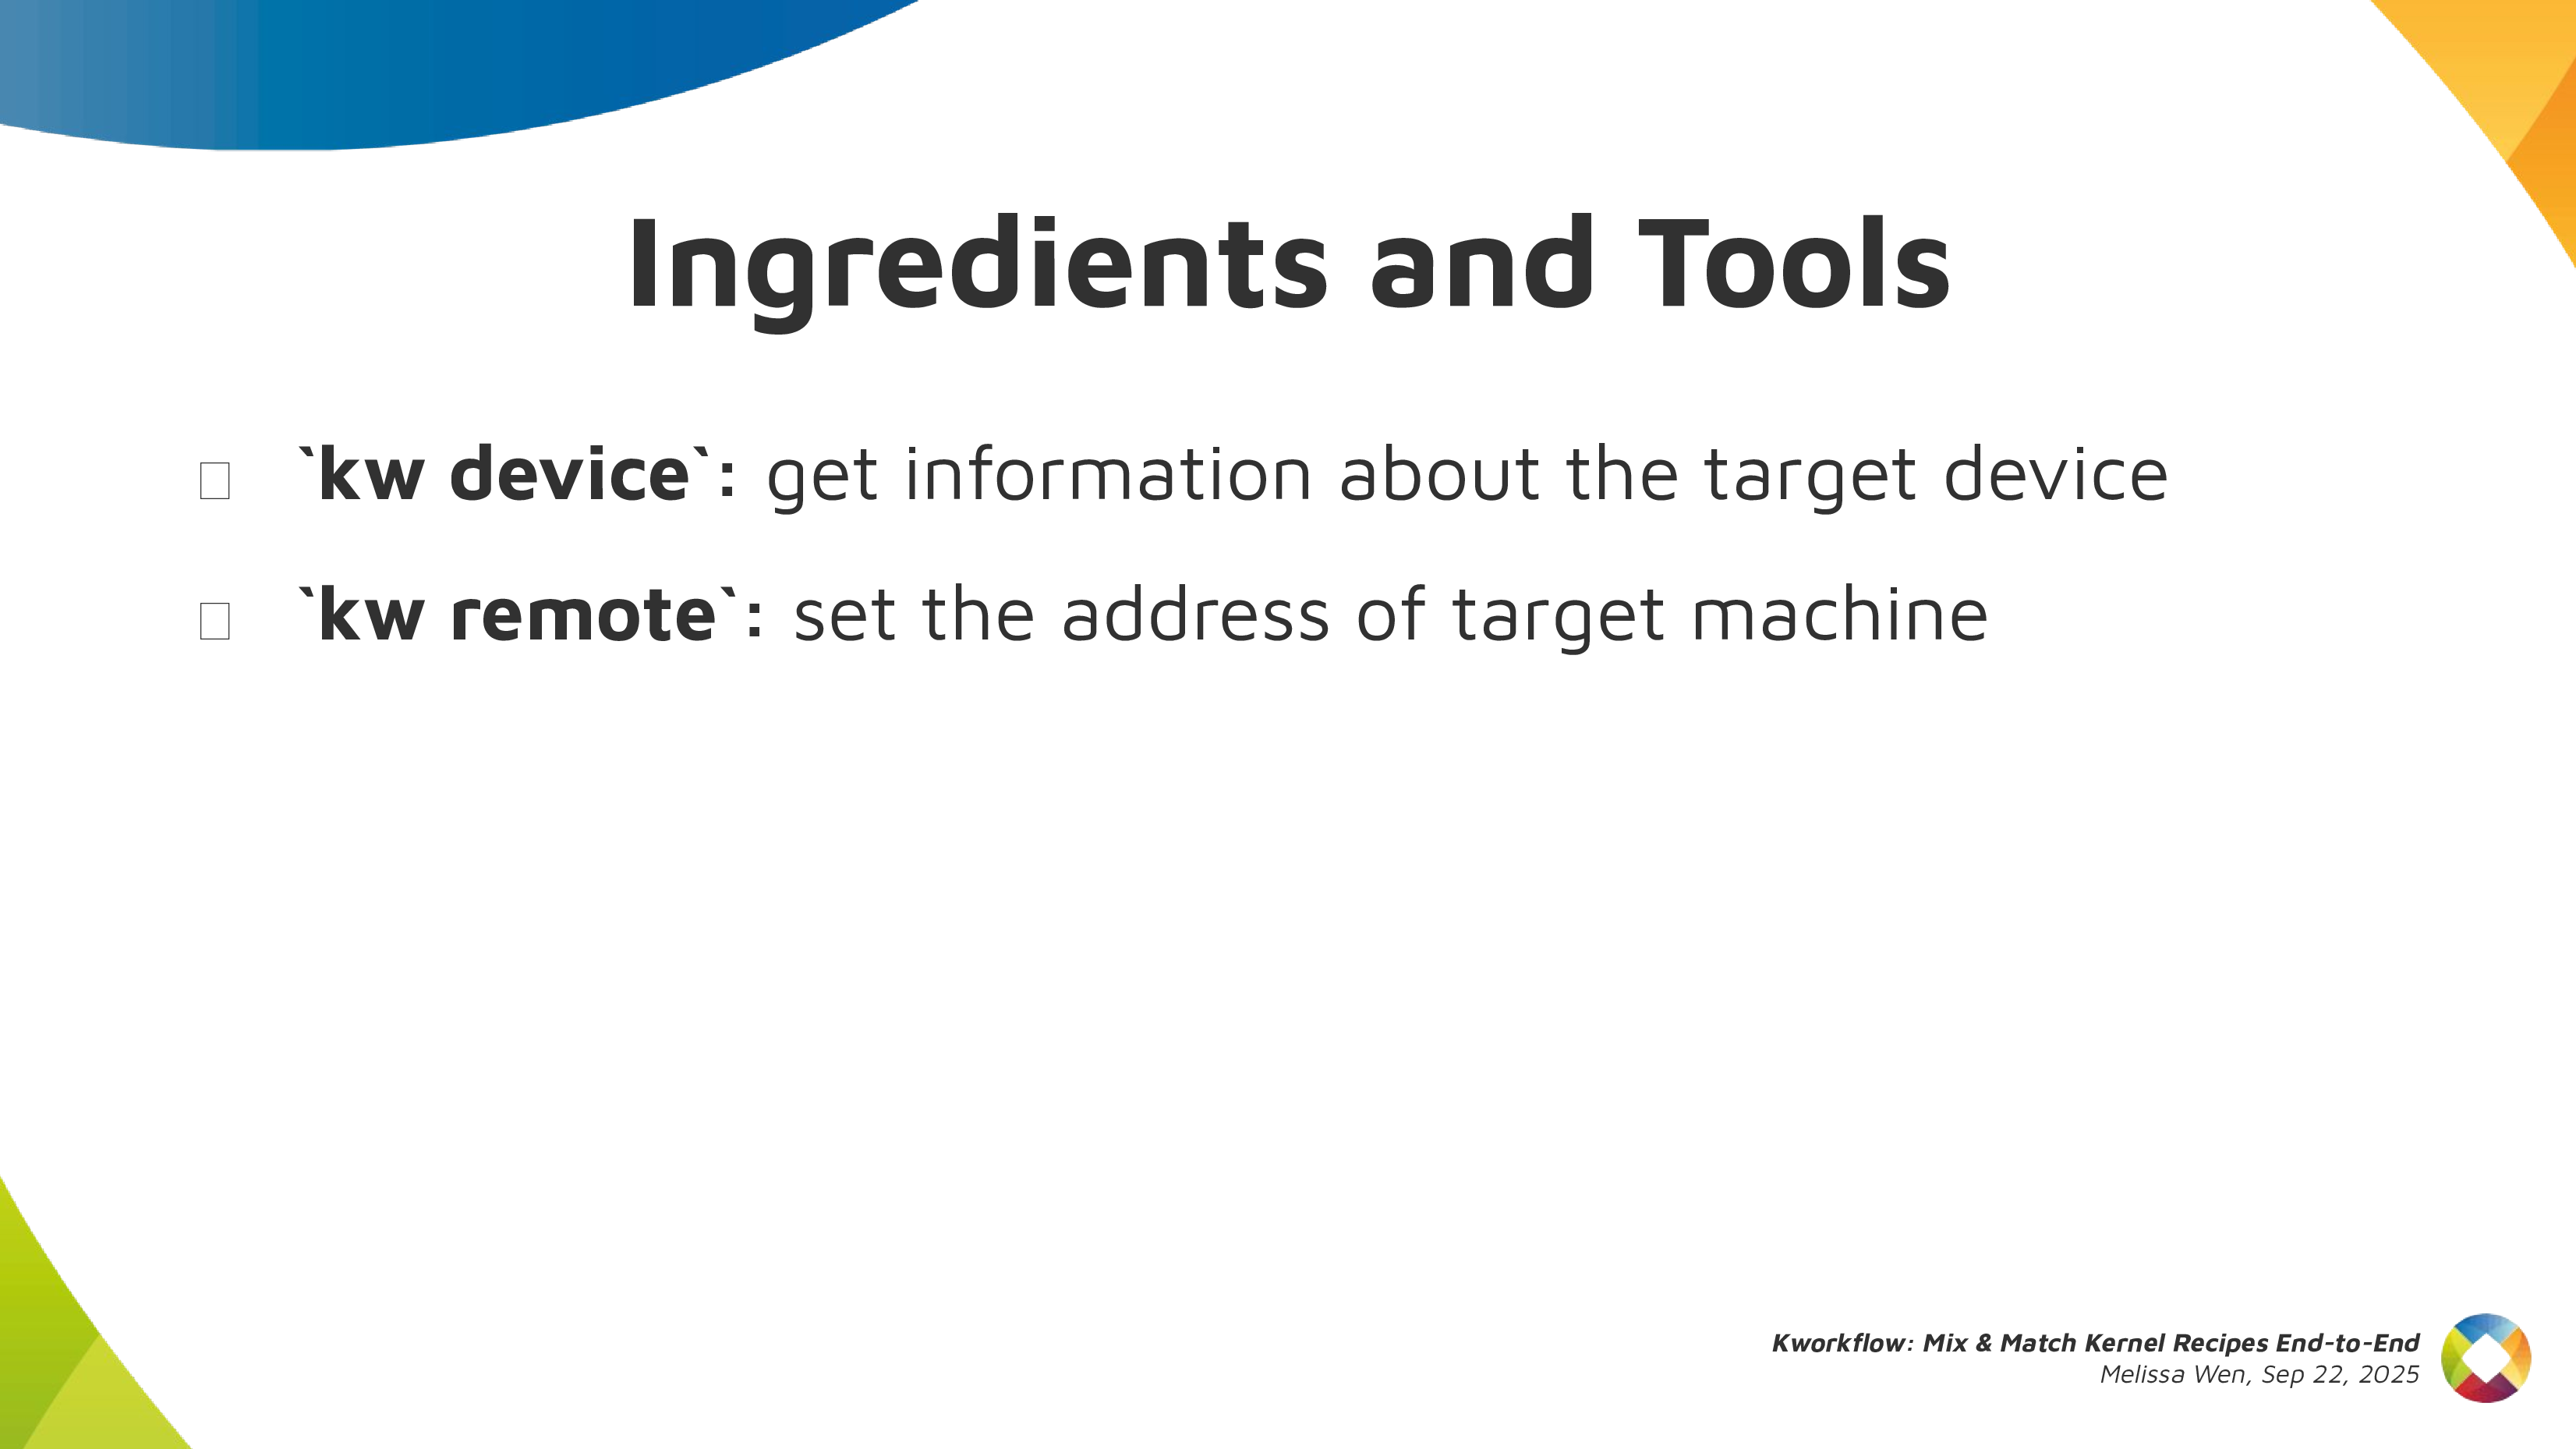
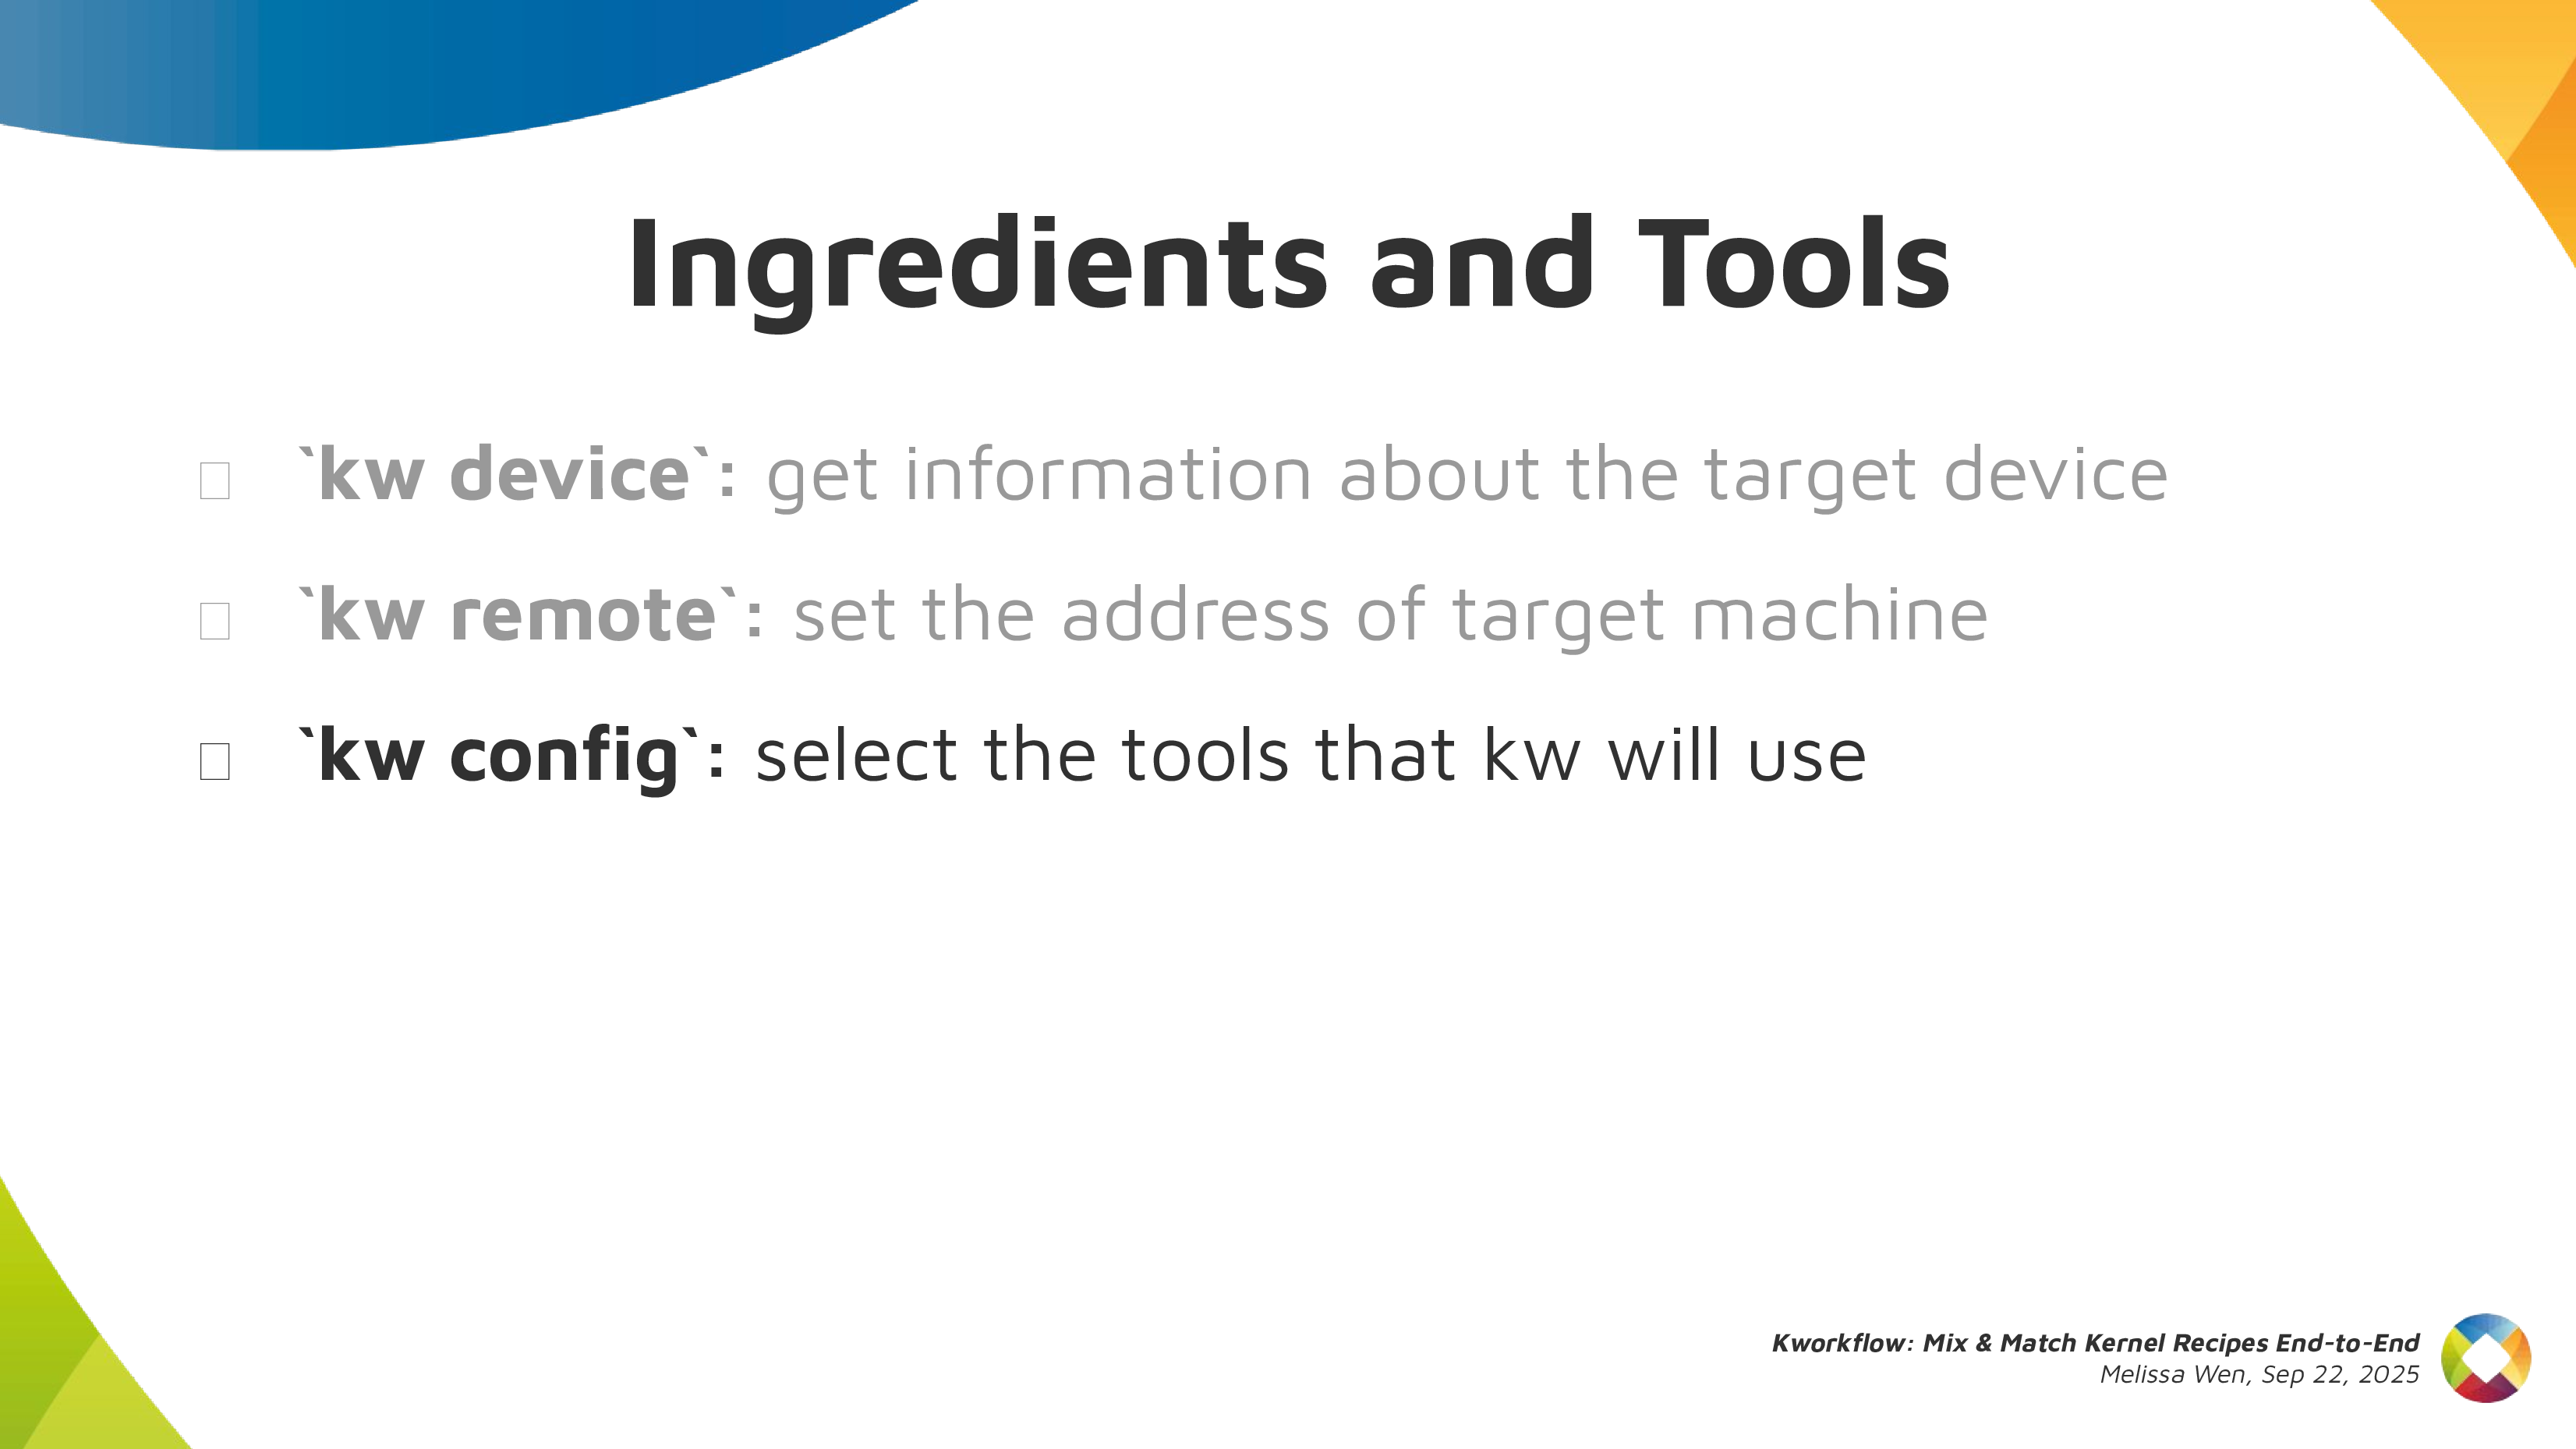
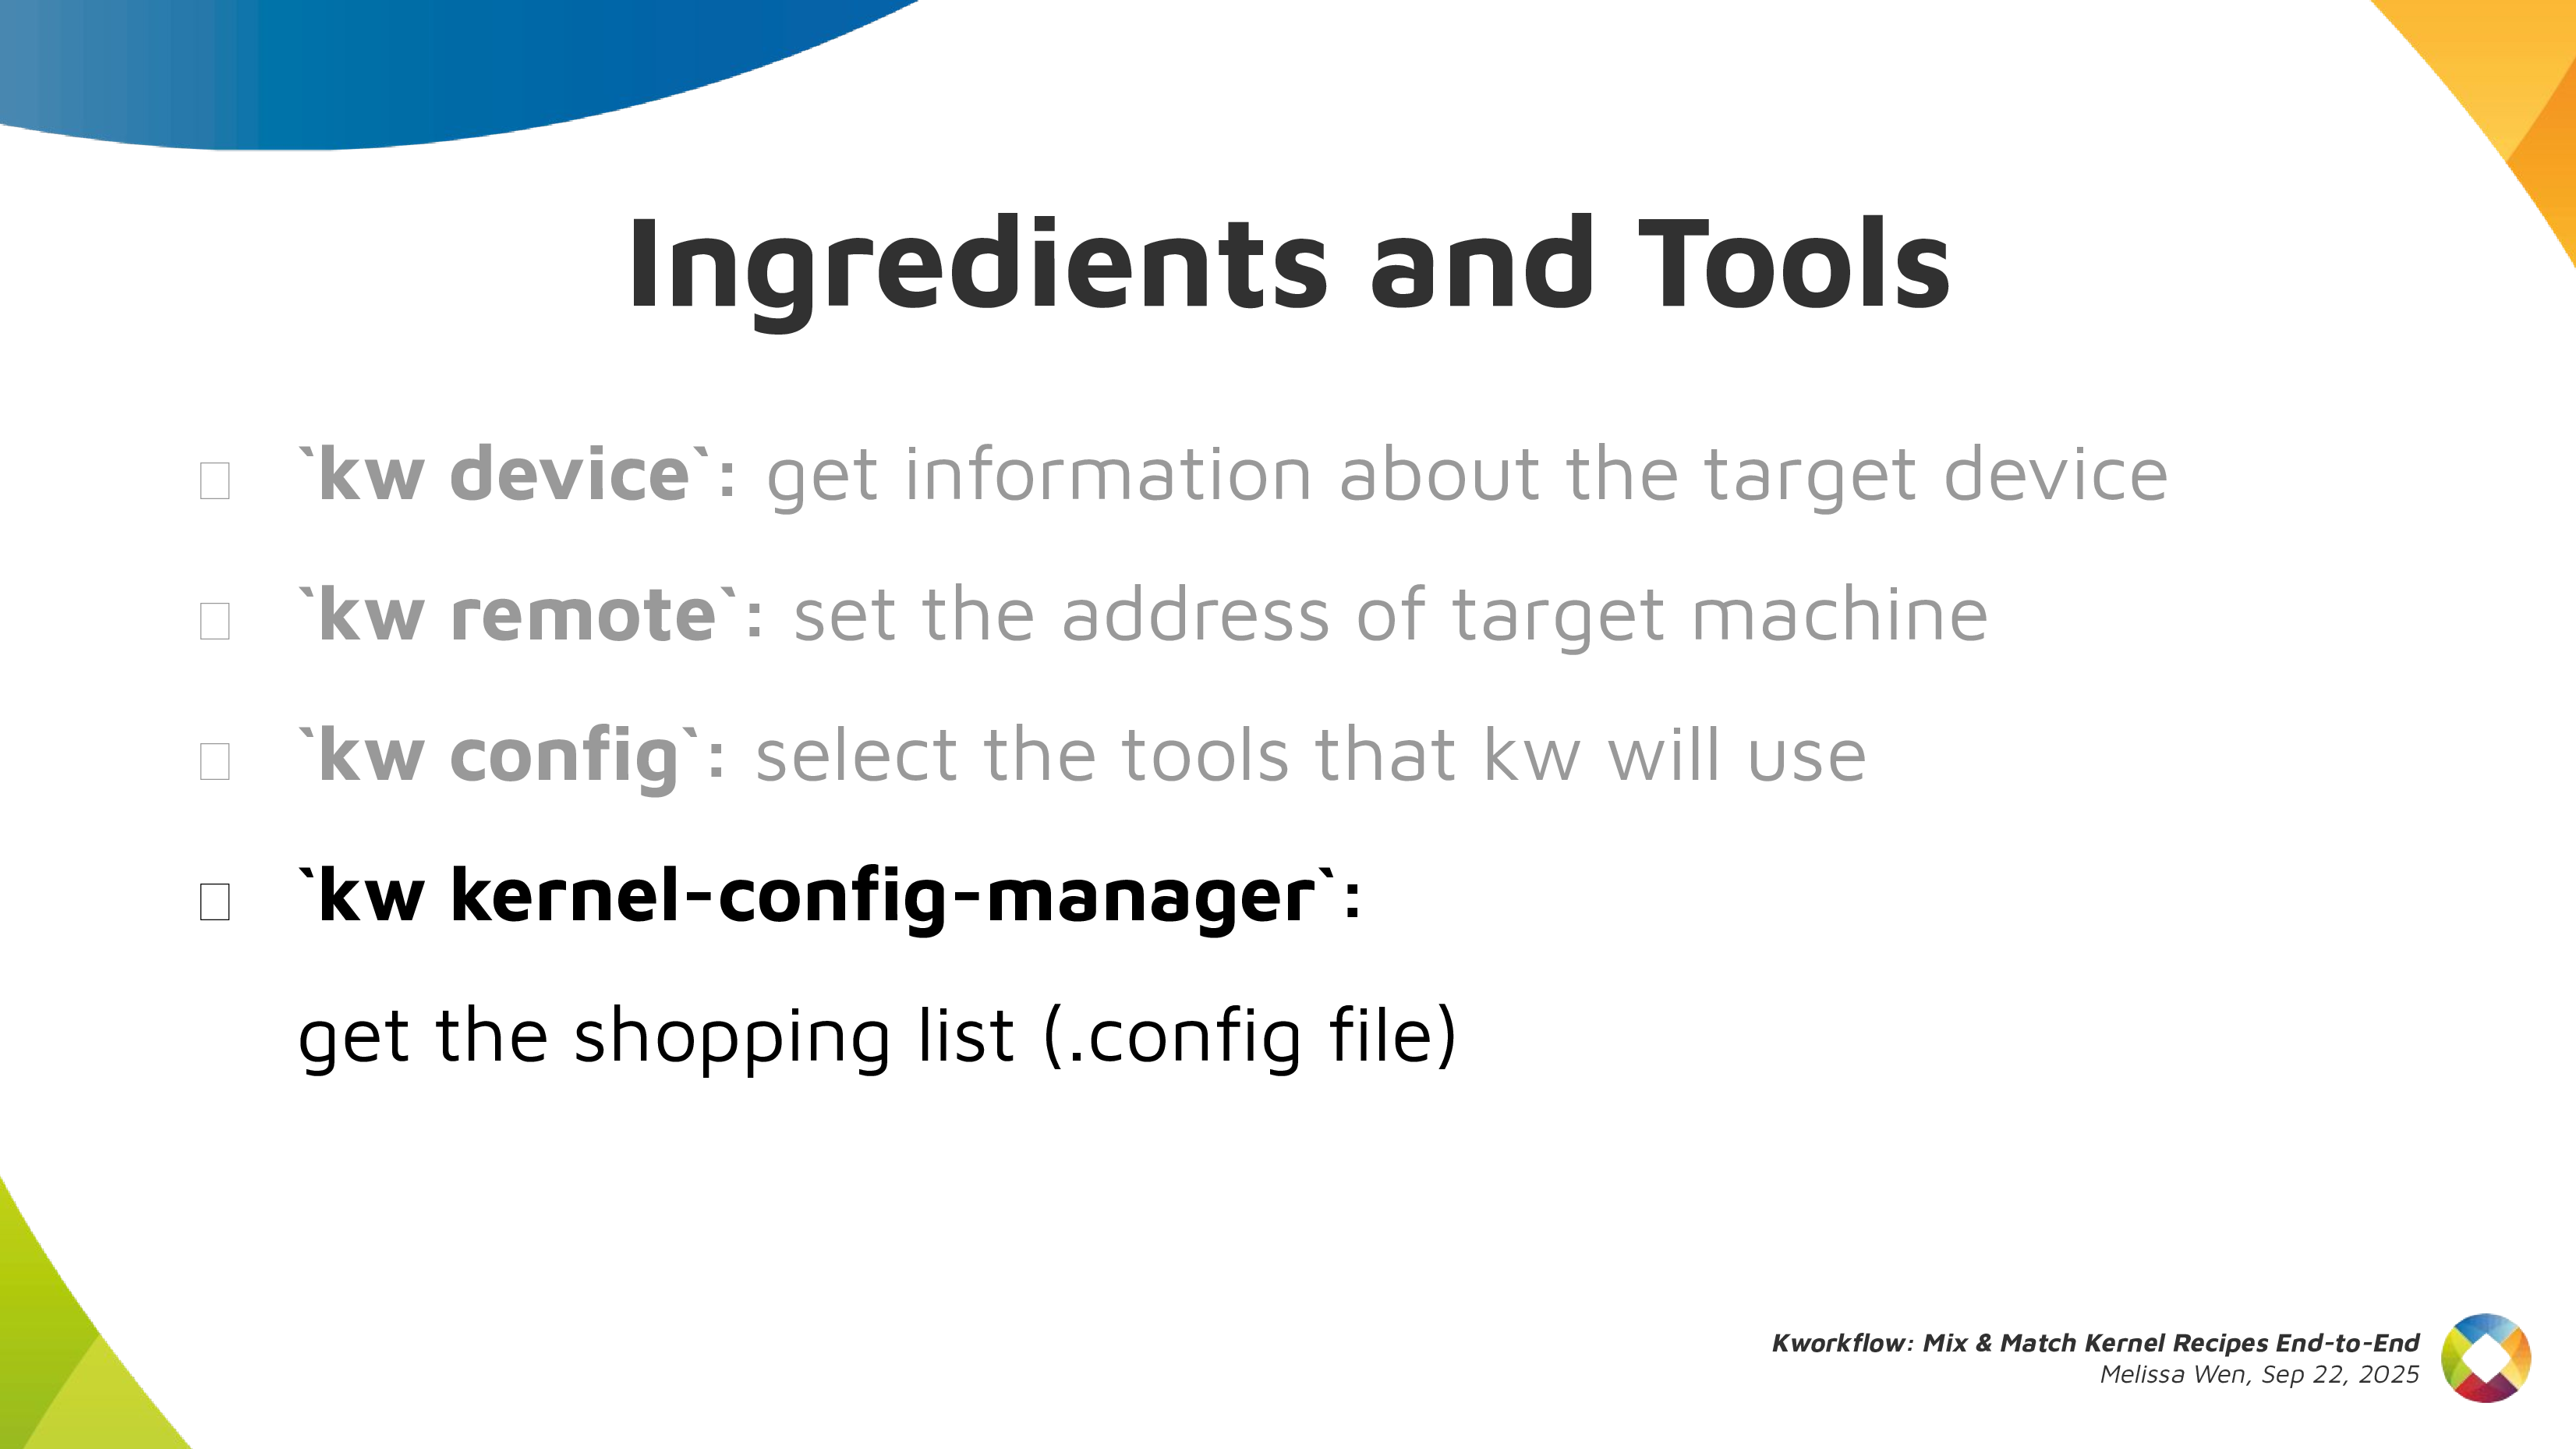


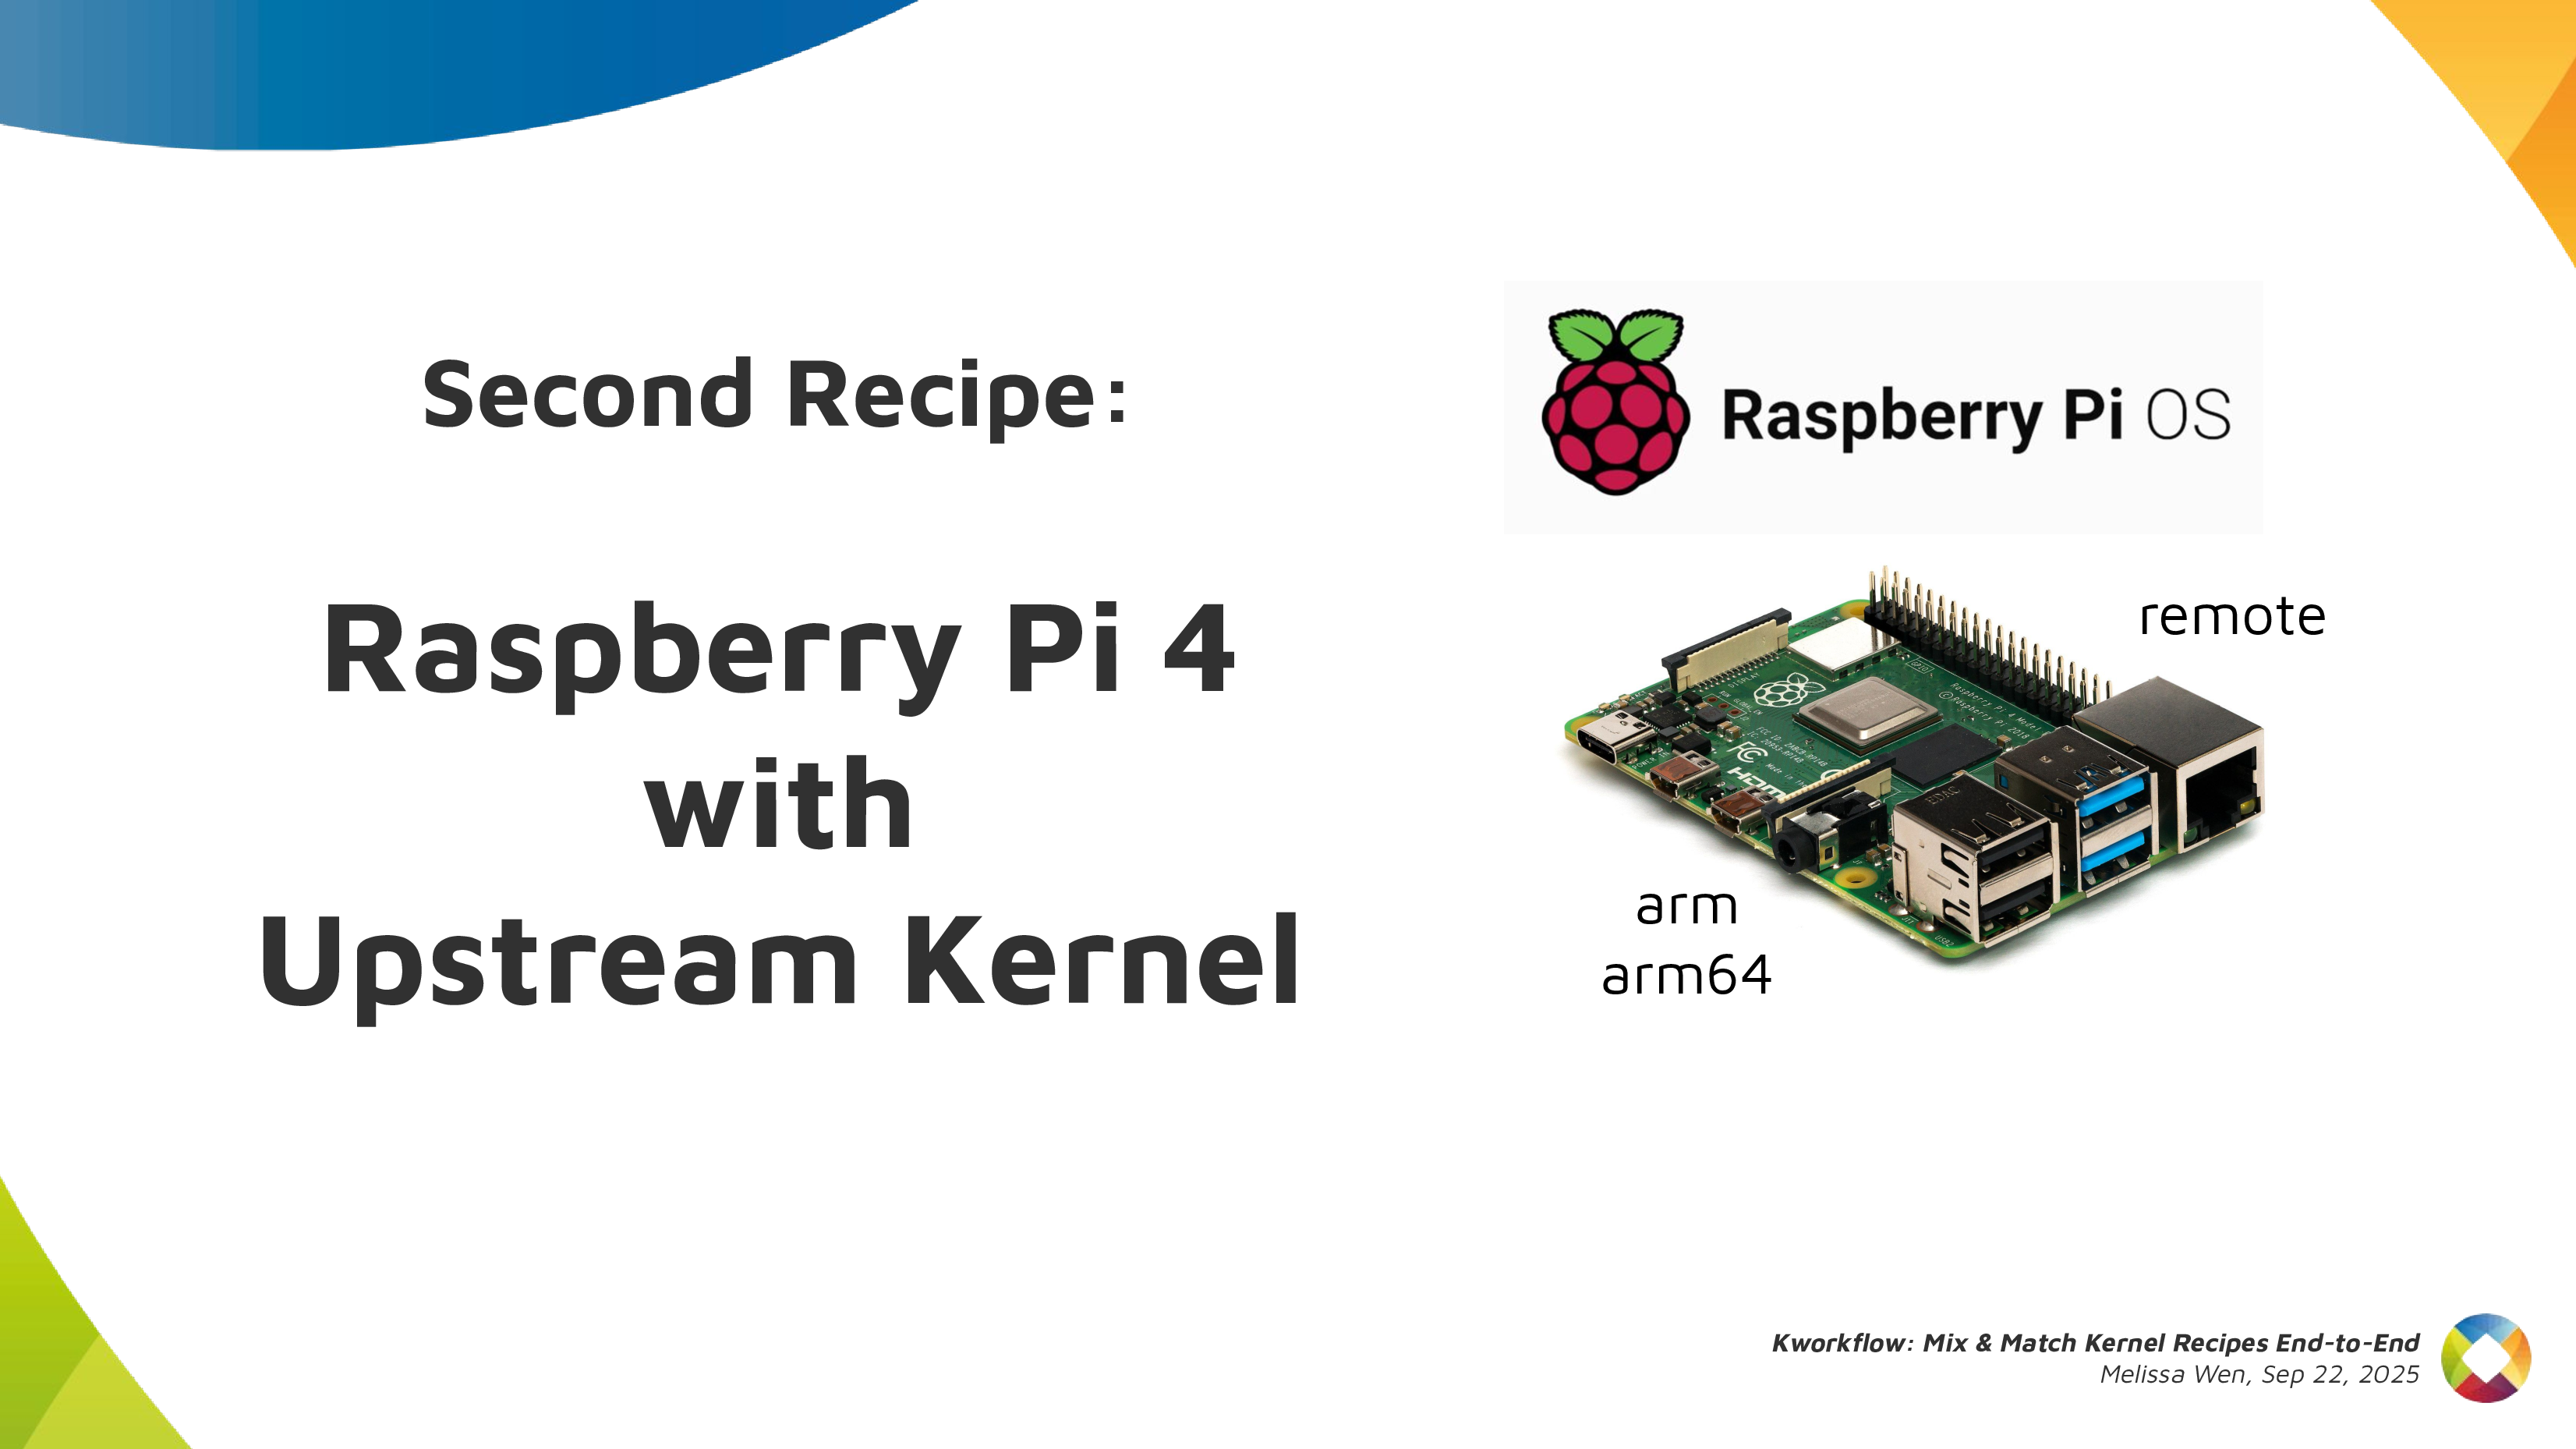

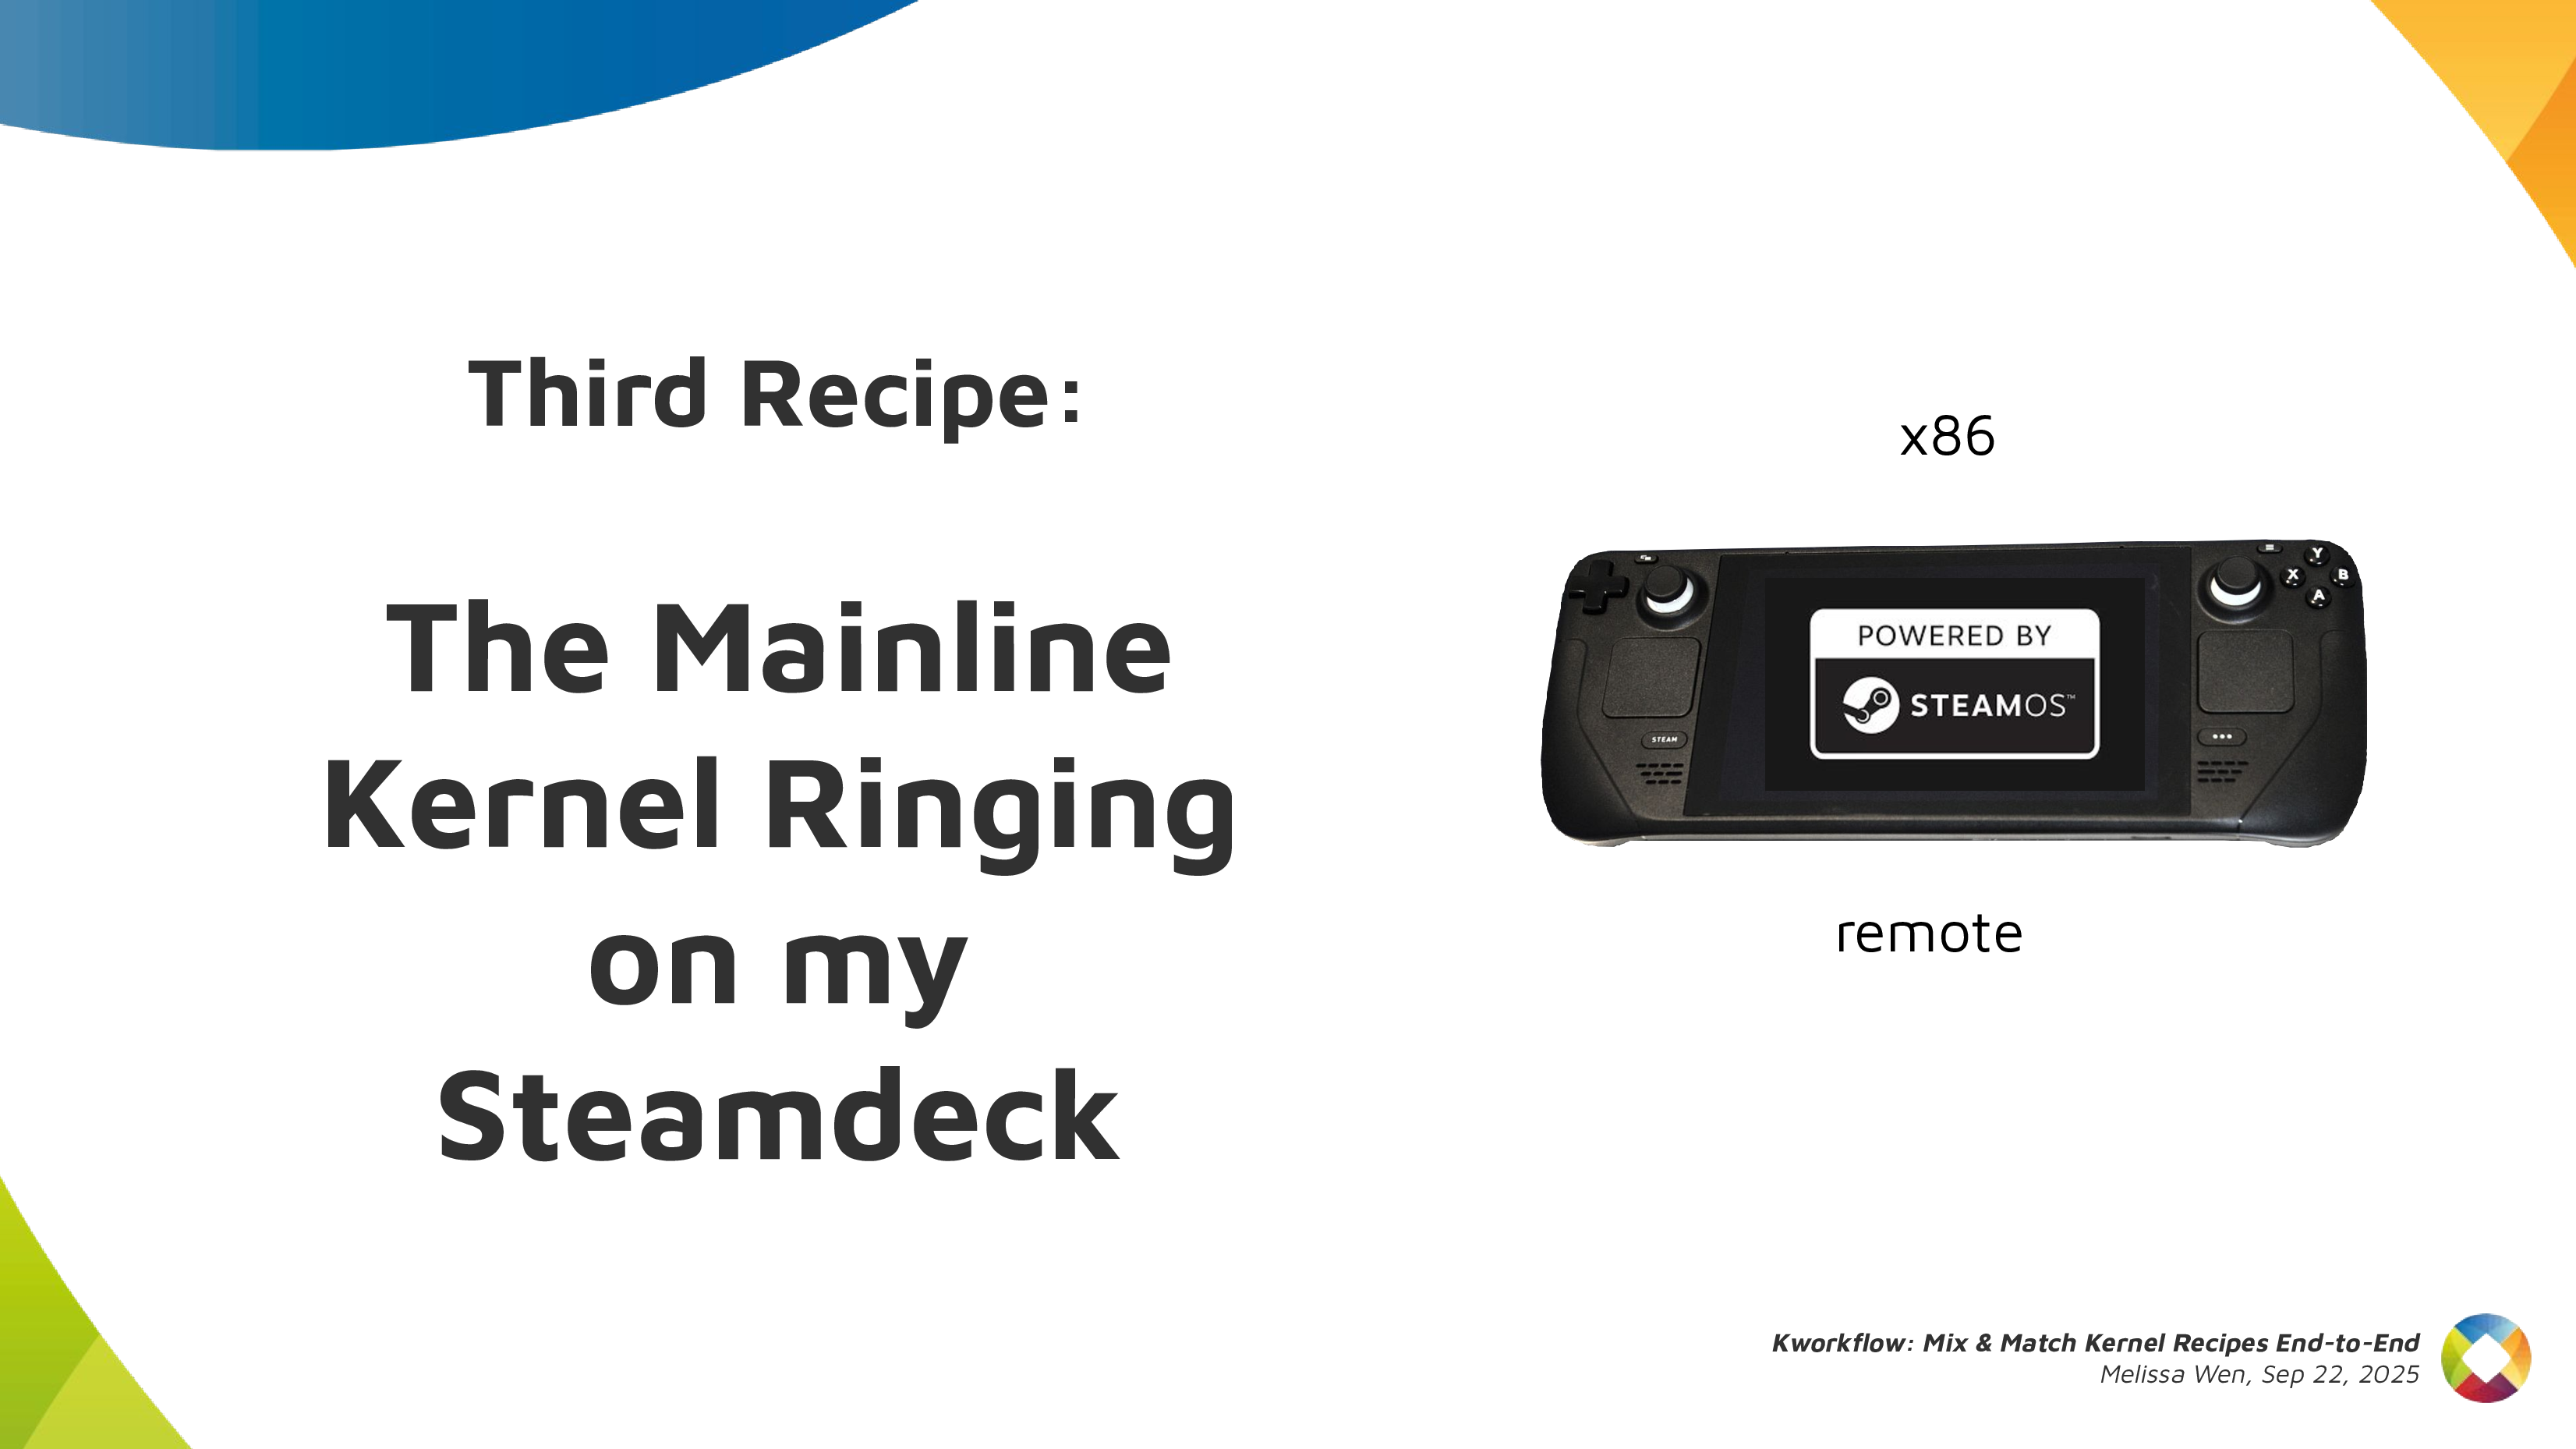

 . What things? Anything JavaScript makes possible.